


Discussion > A temperature timeline for the last 22,000 years
EM.
Water is just a feedback. Really?
Suggest you consult wiki as soon as possible. Pay particular attention to the diagram showing the spectrum of outgoing radiation and notice the dark bands labelled H2O.
Come back and recant.
 ACK
ACK
As Disraeli said, there are lies, there are damned lies, and there are statistics. In the modern age, one might add to that list political spin. Given the difficulty of discerning the truth in the conflicting stories put out there, I'd be interested to read what Entropic Man makes of this from David Whitehouse at GWPF: http://www.thegwpf.com/a-ten-year-hiatus-in-arctic-ice-decline/
Follow the link to see the graphs referred to - words cut & pasted below:
It’s that time of year when the minimum ice extent in the Arctic. One common way to look at it is to pick a particular month and wield a straight line. Fig 1 is from 1979 showing the ice extent going down and down, prompting claims of an ice-free Arctic sometime in the near future. It shows the declining Arctic ice cover which seems precipitous until one considers that it is a decline of about 10% by its measure of ice extent in 35 years! Important certainly but not as dramatic as the graph shows. But with graphs like those one needs to step back and consider the context, for it does not show what it appears to.
Between 1979 and 2015 – the years covered by the graph – atmospheric CO2 levels increased a lot, from 340 ppm to 400 ppm. To put it into context the increase from 1960 to 1979 was just 25 ppm. Fig 1 shows that during this unprecedented increase the gradient – the rate of decline – of the sea ice loss remained constant. In other words the addition of almost 20% of CO2 into the atmosphere did not change the behaviour of the sea ice at all. If one was being strict, based only on the arctic ice data and CO2 information, one would have to conclude that there is no correlation between Arctic sea ice extent and atmospheric CO2 levels! Surely one might have expected the more CO2 in the atmosphere the greater would be the so-called polar amplification effect, and the greater the decline in the rate of loss of sea ice.
As I wrote when looking at last year’s data the declining Arctic ice cover has been one of the most powerful images of climate change and that many who follow the debate don’t look too hard at the data. This results in superficial reporting that does not convey any of the complexities of the situation and as such is poor science communication.
Last year a suggestion (which had been made before) that Arctic ice was more resilient that was thought prompted much discussion but little media coverage despite the research being published in Nature Geoscience by Tilling at el (2015) called “Increased Arctic sea ice volume after anomalously low melting in 2013.” The headline was that the volume of Arctic sea ice increased by about a third after an unusually cool summer in 2013. Reports went on to say that the unusual growth continued in 2014 and more than compensated for the loss in the three previous tears. Overall it was concluded that changes in summer temperatures in the Arctic have a greater impact on the ice than was thought.
This years minimum was reached on day 254 (September 10th) of the year (nothing unusual). The minimum ice extent was also nothing unusual at 4.1 million km2, not the lowest and about the same as 2007. Some media reports portrayed this as the second lowest (behind the anomalous year of 2012) and mentioned its comparison with 2007 without making the obvious comment that it was curious in these days of much talk of rapid ice decline in the Arctic that the minimum extent was the same as it was 9 years ago!
Here is the minimum extent since 2007 (millions of sq km) and it is obvious there is no general decrease in minimal ice area, by this measure, between 2007 – 2016 – ten years! Did anyone run the headline that Arctic minimum ice extent has showed no significant change in the past decade? The case can be made that the behaviour of the Arctic ice cover has changed from the declining years of 1998 – 2007.
Mark Hodgson
Mark Hodgson, EM posted the sort of dire warnings and horror stories that I used to believe, and were easy and scary ones to display on TV, with icebergs calving off glaciers and ice sheets into the sea, and polar bears scared of drowning if they get their feet wet.
I have never seen sea ice, but from school I remember the heroic failures of yesteryear, and particularly the North West Passage. The more that modern day adventurers claim the sea ice has never shrunk to such levels before, the more evidence keeps being found of Victorian explorers having been there before.
We were told by experts the sea ice is where global warming would be seen first. So lots of money has been spent sending expeditions with cameras and US Presidents for photo opportunities. It now seems that sea ice decline has peaked, or troughed, depending on your viewpoint, just like it has done before.
Climate Science ignores history, because what happened before, is happening again, over similar timescales, without assistance from CO2.
golf charlie
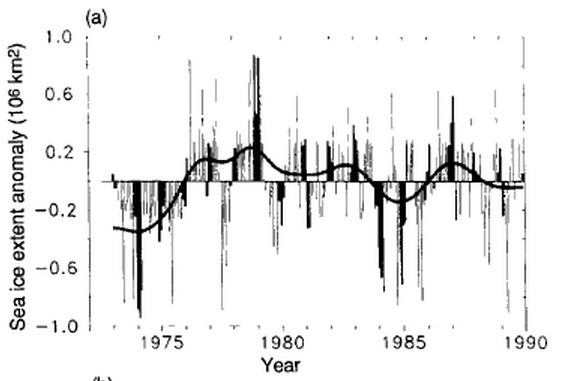
Regarding Arctic ice extent, I have found the link to the NOAA paper I mentioned earlier – here. Go to page 61 of the .pdf file (labelled 51 in the actual document), to see a graph showing that measurements started in 1973 (entitled “ARCTIC SEA-ICE AREA (10**6) SQ KM FOR 1973-1990”), the extent then being very little different from what it is now. However, 1979 shows abnormally high. I wonder why so many insist on starting the measurements in 1979?
Radical Rodent
https://wattsupwiththat.com/2016/09/23/lewandowsky-and-cook-deniers-cannot-provide-a-coherent-alternate-worldview/
It does seem that various people have been using this blog to challenge anyone to come up with a better theory, in order to support the latest failure theory from Cook and Lewandowsky.
Just because Climate Science has had all the money, and has failed to come up with a credible theory to explain their failures, does not make it a problem that needs fixing. If there is no earthly cause to historic changes in earth temperatures, there is no earthly reason why earthlings should be forced to pay astronomic prices to fix something written in the stars.
golf charlie
Radical Rodent
On February 18th 1979, snow fell in the Sahara Desert. This was a good year to start Global Warming records from,
golf charlie
RR - here's the same graph which the IPCC WG1 published - before they were hijacked by the alarmists: IPCC 1990 WG1. [Source: www.ipcc.ch/ipccreports/far/wg_I/ipcc_far_wg_I_full_report.pdf ]
 lapogus
So… the Arctic sea ice is NOT in a death spiral… who would’ve thunk it?!
But… if that is the case, what are we worried about? Perhaps Ent will be able to help with that one…
ha. ha. ha. ha.
Radical Rodent
Mark Hodgeson
Your quote about statistics summed up your ignorance of statistics.
Every point you made illustrated that you do not understand the difference between short term variation and long term trend. It is a typical contrarians propoganda trick to highlight every short term rise in sea ice and pretend that it is a long term trend.
In practice the long term trend is down.
Load the NSIDC October 2015 archive . Scroll down in the review to the graph headed "Average monthly Arctic Sea ice extent September 1979-2015".
The graph shows two things of interest. The long term trend shows a decline of 13.4%/decade.
There is also considerable variation from year to year. Look at the minima and you will see seven record years between 1979 and 2015. They are spaced, on average, 5.3 years apart. The shortest interval is 3 years and the longest 7 years. It is four years since the 2012 record, not even the average interval.
I repeat. Stop cherrypicking short term variation and pretending that it represents the long term trend. While you are at it, stop pretending that every non-record year indicates a long term recovery.
Entropic man
ACK
The water vapour feedback is a big part of the reason why climate sensitivity is so high, but It is a feedback, not a forcing.
Temperature drives water vapour, not the other way round. Increase the temperature 1C and you get 7% more water vapour if a source is available,
Decrease the temperature below 0C and the water vapour condenses. Look at the dew.and ice on your car after a cold night.
Entropic man
Hapless Hamster
See my comment to Mark Hodgeson.
Entropic man
EM. Are you really so ignorant as to deny that water vapour is the most important greenhouse gas, and is only a feedback?
ACK
EM. You don't need to cool down to 0oC to get condensation, just to below the dew point. I've experienced heavy dews in the desert. Yes temperatures fall precipitously at night, but not to freezing point. Also look at a boiling pan of water with a transparent lid - observe condensation. If temperatures are 0oC or lower you get ryme not dew. Do get your physics right.
ACK
EM, ok, I give up, what am I expecting to see if I watch the dew AND ice on my car on a cold night? It is more relaxing to watch condensation on taps having run a hot bath.
I have been in a decompression chamber and experienced how changes in pressure alter dew point temperatures, but it was not possible to run a hot bath in the decompression chamber, and they didn't cover that in "O" Level Physics for some reason.
golf charlie
Ravishing Rattie. (Sep 24, 2016 at 3:28 PM)
You have such a dirty laugh.
Bet you're not laughing about "Hapless Hamster". I have taken appropriate cover.
ACK
Radical Rodent, Climate Science has meant pouring money down the drain, now Climate Science will follow, going into it's own Death Spiral. What I am not sure about, is whether Antipodean Climate Science Spin Doctors will rotate clockwise or anticlockwise as they disappear down the plughole, but that may be Lewandowsky and Cook's next science busting exclusive.
golf charlie
I’m sorry, Ent, but why do you consider regarding the entire record of satellite observations to be cherry-picking? Surely, selecting point which just so happens to be when the sea-ice was at its maximum extent is more likely to be cherry-picking? Viewing the entire record shows that there is very little decrease in Arctic sea-ice, so I suppose something that does not support your empty theory should be ignored…
Well, you can do that, but those with proper scientific thinking prefer to look at the whole picture, not just that which upholds your beliefs.
Don’t worry, Minty, words will never hurt me (unless a sign drops on my head, of course!), especially when they emanate from such as Ent. While I might respond (hopefully with a killer witty response that leaves you rolling in the aisles, as well as nursing a bruised ego) should the likes of you, GwenC, MJ and others make such a comment, all I can say to Ent is… meh… Anyway, I have a full stock of haps, so know he is wrong; also, people do tend to find hamsters far more attractive than rats, so I could take it as a compliment.
Radical Rodent
ACK
We are talking about the same thing. Water vapour content of the atmosphere is driven by local conditions, climate or forcings, not their driver.
That is why water's warming effect should be regarded as a feedback, not a forcing.
Entropic man
Ravishing Rattie I was not worried at all, I've watched in awe you take down better men than EM. I was eagerly anticipating a new example of your technique. I was on the bleachers waving flags urging you on. Perhaps next time.
Why Ent? They are trees, made of wood.... Oh I see. Be careful RR, someone might bring up the topic of the missing Entwives.
ACK
EM. Are you for real, you used to be a science teacher for goodness sake?
1 There is enough water vapour in the atmosphere over the driest deserts to saturate the water absorption bands of the incoming solar radiation. It is by far the most important GHG.
2 The water feedback is overplayed. You have seemingly forgotten that, outside the laboratory, the atmosphere continues to rain out even well below saturation levels.
ACK
EM. Carbon dioxide is released from the ocean as it becomes warmer. Plants take up CO2 when its warm and sunny, and it is released when conditions turn cold and dark. Using your reasoning about water vapour, CO2 is a feedback not a forcing.
ACK
Entropic Man
If you weren't so obsessed with one version of events, you might manage to read things at face value. I asked a polite question, in context, made no claims about the GWPF report, merely asked for your comments on it, and you respond by rudely telling me I am ignorant of statistics, based on completely no evidence. Play the man, not the ball, eh? Standard alarmist fare. You have done yourself no credit.
Please also learn to spell my name correctly - it's not difficult.
Mark Hodgson
Radical Rodent
Is Ent an example of your wooden humour or at you really comparing me with those wise and ancient beings? If you are trying to annoy me, remember Isengard.
Interesting graph. Did you notice that the 1979 peak was in the Winter data, rather than the more important Summer data?Did you also notice that the Antarctic data includes a big decrease in area after 1973?
Entropic man
EM 11:23 Sea level has been rising in a linear fashion. It has not accelerated.
You then say it is going to get worse, having previously stated that Glaciers are decreasing along with Greenland ice cover. Where is the missing ice going to? If this is the historic rise in sea levels, then it has been going on for a lot longer than the global warming scare.
Arctic sea ice does not seem to have done anything more dramatic than it has over the last 100 years, and Antarctic sea ice seems perfectly healthy aswell. You do seem to believe the claims of Mark Serreze and Peter Wadham.
Ice sheets sliding into the sea is just wild speculation.
Why will ocean temperatures start to rise rapidly, when the atmosphere hasn't?
There remains no sign of fossil fuels running out.
Your post is just factless scaremongering. The good news is that politicians are getting fed up with it. The funding for Climate Science is entering a Death Spiral, you need to concentrate on saving the good bits, about 3% of the total ouput, but probably the stuff you have ignored.