


 Bishop Hill
 Climate sensitivity and the Stern report
Climate: Models Climate: WG3 Economics From time to time I have been taking a look at the Stern Review. It seems so central to the cause of global warming alarmism, and while there's a lot to plough through this does at least mean that one may come across something new.
As part of my learning process, I have been enjoying some interesting exchanges with Chris Hope of the Judge Business School at Oxford Cambridge. Chris was responsible for the PAGE economic model, which underpinned Stern's work. The review was based on the 2002 version of the model, but a newer update - PAGE 2009 - has now appeared and I have been reading up about this from Chris's working papers, in particular this one, which looks at the social cost of carbon.
The first major variable discussed in the paper is, as you would expect, climate sensitivity. The Stern Review came out around the same time as the IPCC's Fourth Assessment Report and so we would expect the take on this most critical figure to be the same in the two documents, and indeed I have seen no sign that this isn't the case. Indeed the working paper notes that the mean is virtually unchanged between since the time of Stern.
The mean value is unchanged from the default PAGE2002 mean value of 3°C, but the range at the upper end is greater. In PAGE2002, the climate sensitivity was input as a triangular probability distribution, with a minimum value of 1.5°C and a maximum of 5°C.
The Fourth Assessment Report reviewed all the major studies on climate sensitivity at the time and reported them in a spaghetti graph, which I've redrawn below:
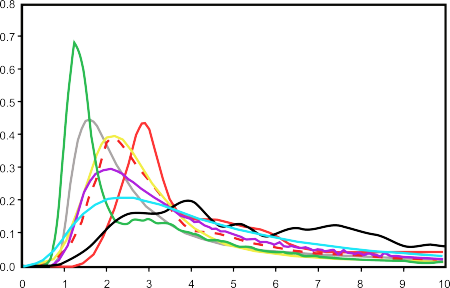
Don't worry for the minute which study is which. We can, for the minute, simply note the very wide range of estimates, with modes between 1 and 3°C (ignoring the rather wacky black line). We also see that the distributions are all skewed far to the right, suggesting median values that are several degrees higher.
In the next diagram I superimpose these values on top of the values used in the 2009 version of the PAGE model.
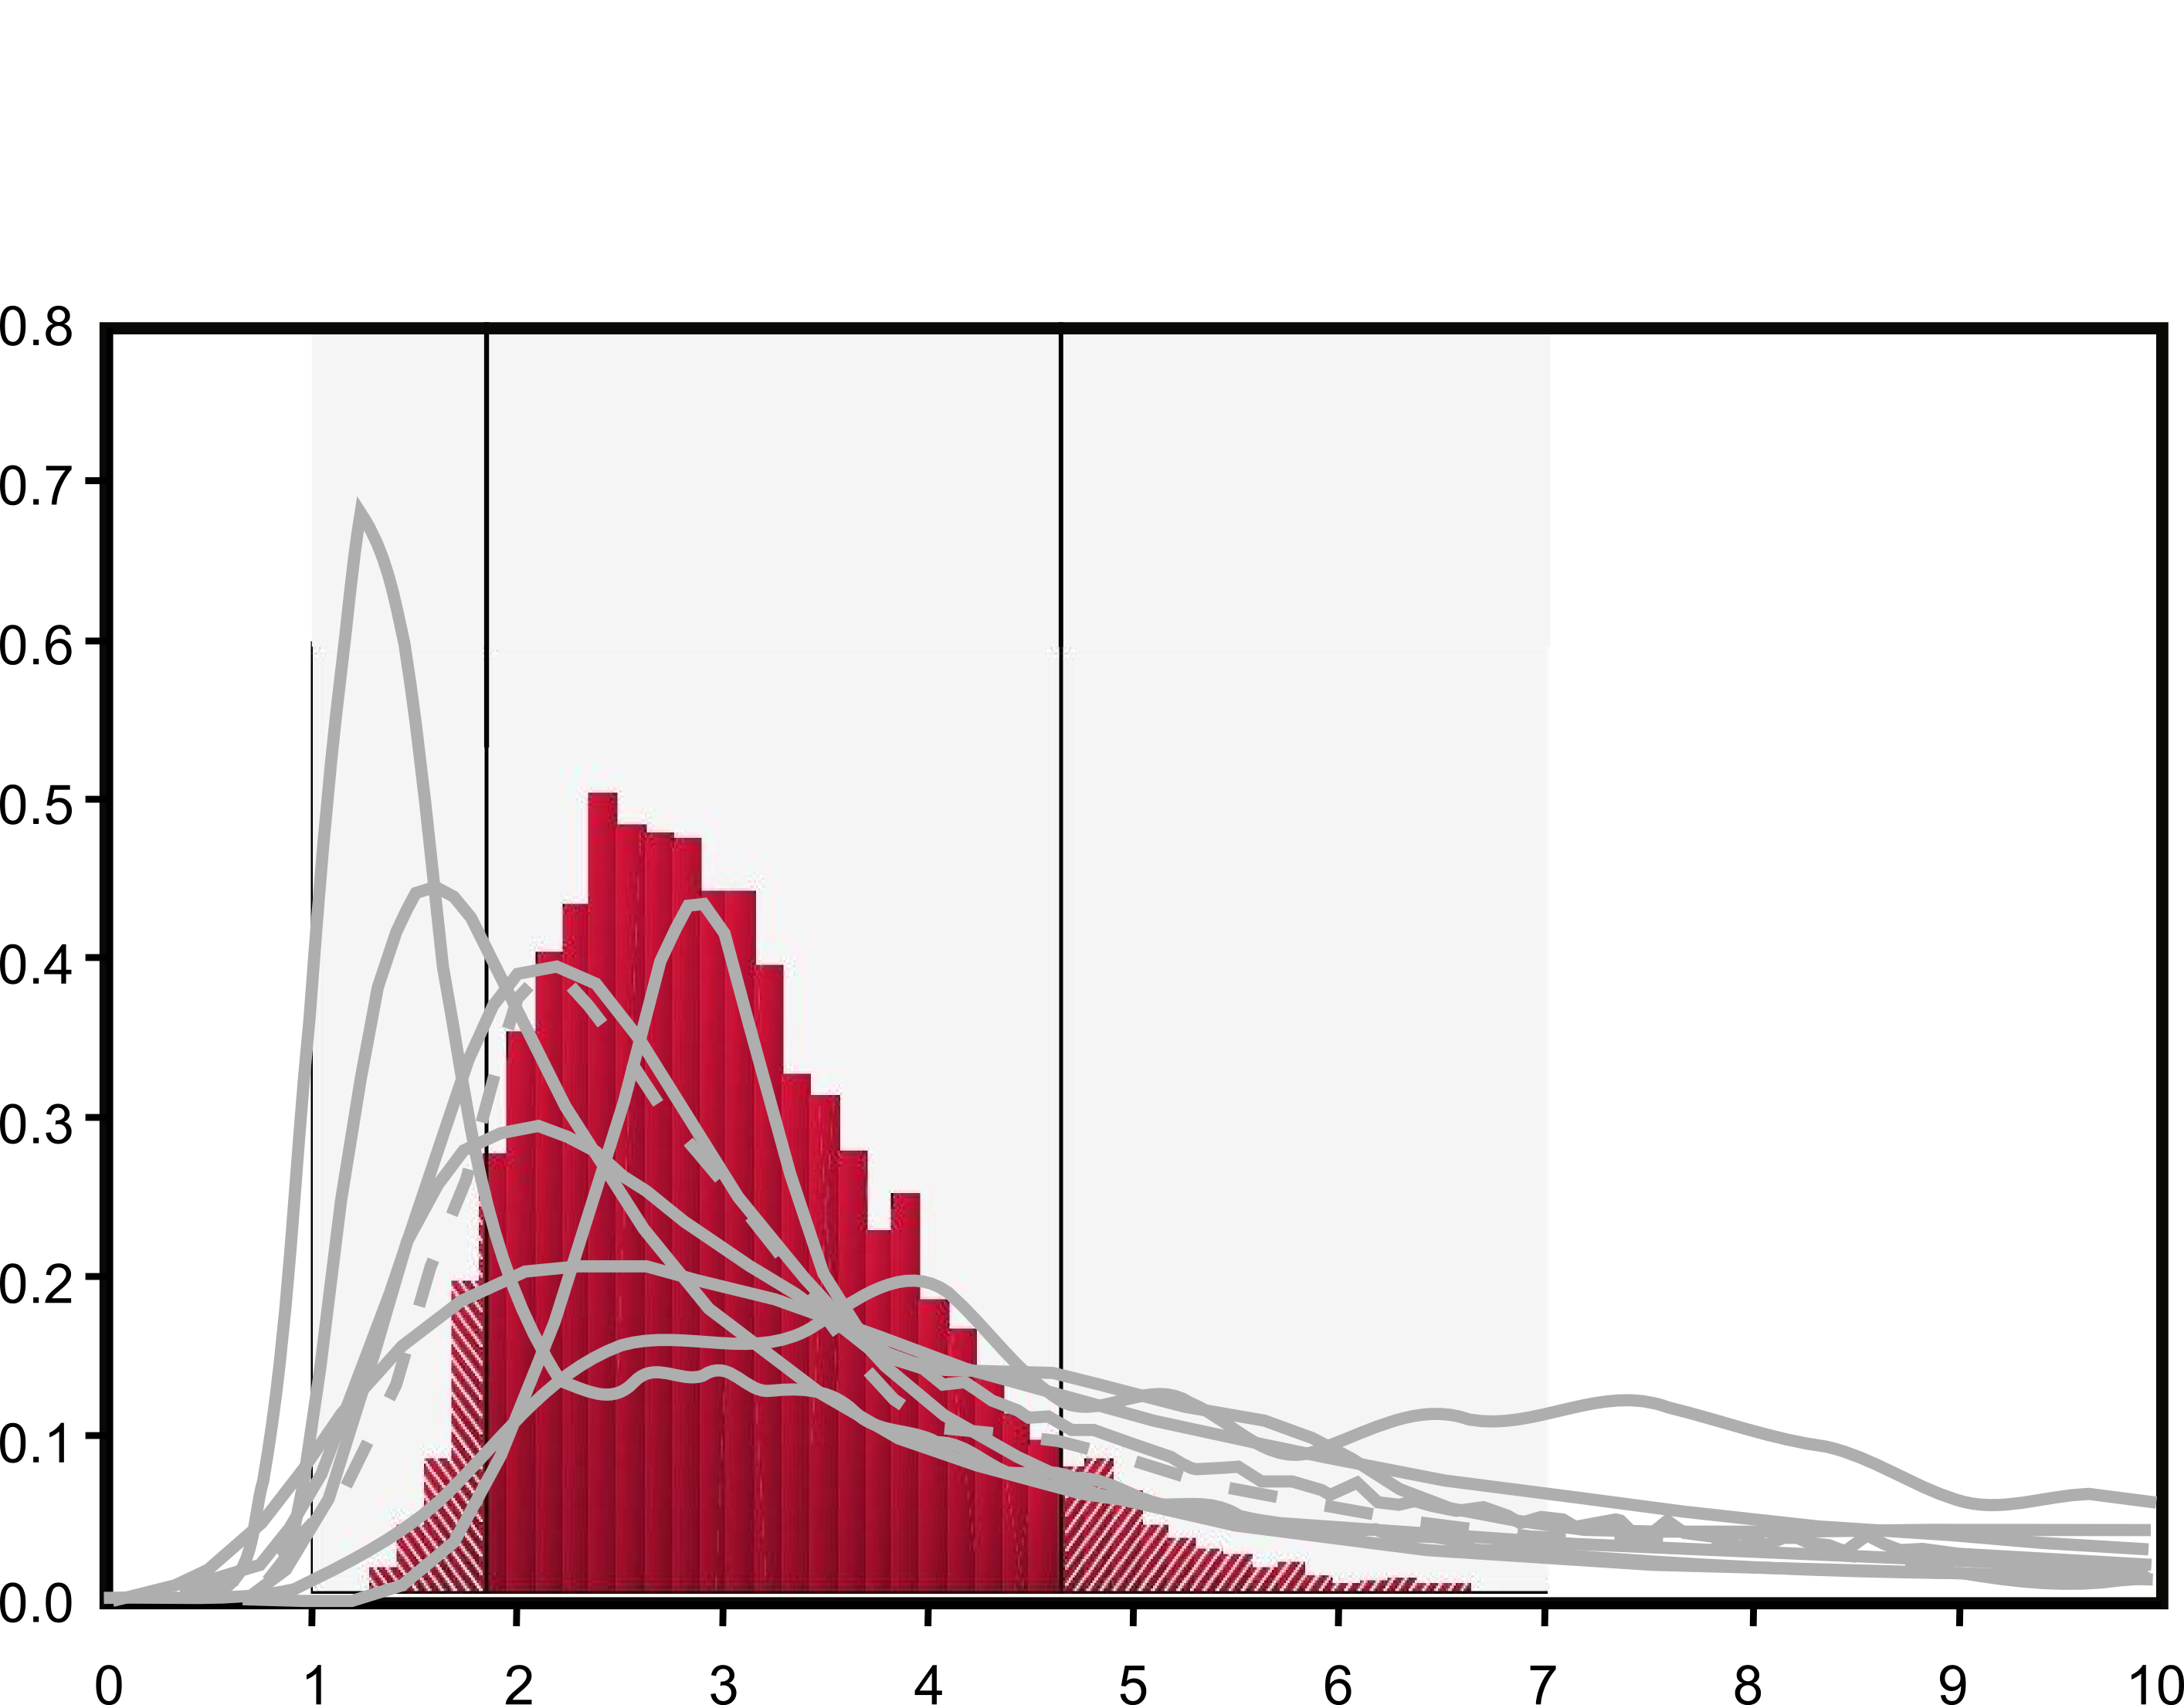
As you can see the PAGE model (in red) seems to pitch itself right in the middle of the range, its distribution seeming to leave out the territory covered by the cooler peaks at the left hand side as well as the catastrophic values at the right. So far, this appears at least defensible.
Chris Hope summarises his values as follows:
The lowest values are about 1.5 degC, there is a 5% chance that it will be below about 1.85 degC, the most likely value is about 2.5 degC, the mean value is about 3 degC, there is a 5% chance that it will be above 4.6 degC, and a long tail reaching out to nearly 7 degC. This distribution is consistent with the latest estimates from IPCC, 2007, which states that “equilibrium climate sensitivity is likely to be in the range 2°C to 4.5°C, with a best estimate value of about 3°C. It is very unlikely to be less than 1.5°C. Values substantially higher than 4.5°C cannot be excluded, but agreement with observations is not as good for those values. Probability density functions derived from different information and approaches generally tend to have a long tail towards high values exceeding 4.5°C. Analysis of climate and forcing evolution over previous centuries and model ensemble studies do not rule out climate sensitivity being as high as 6°C or more.” (IPCC, 2007, TS4.5)
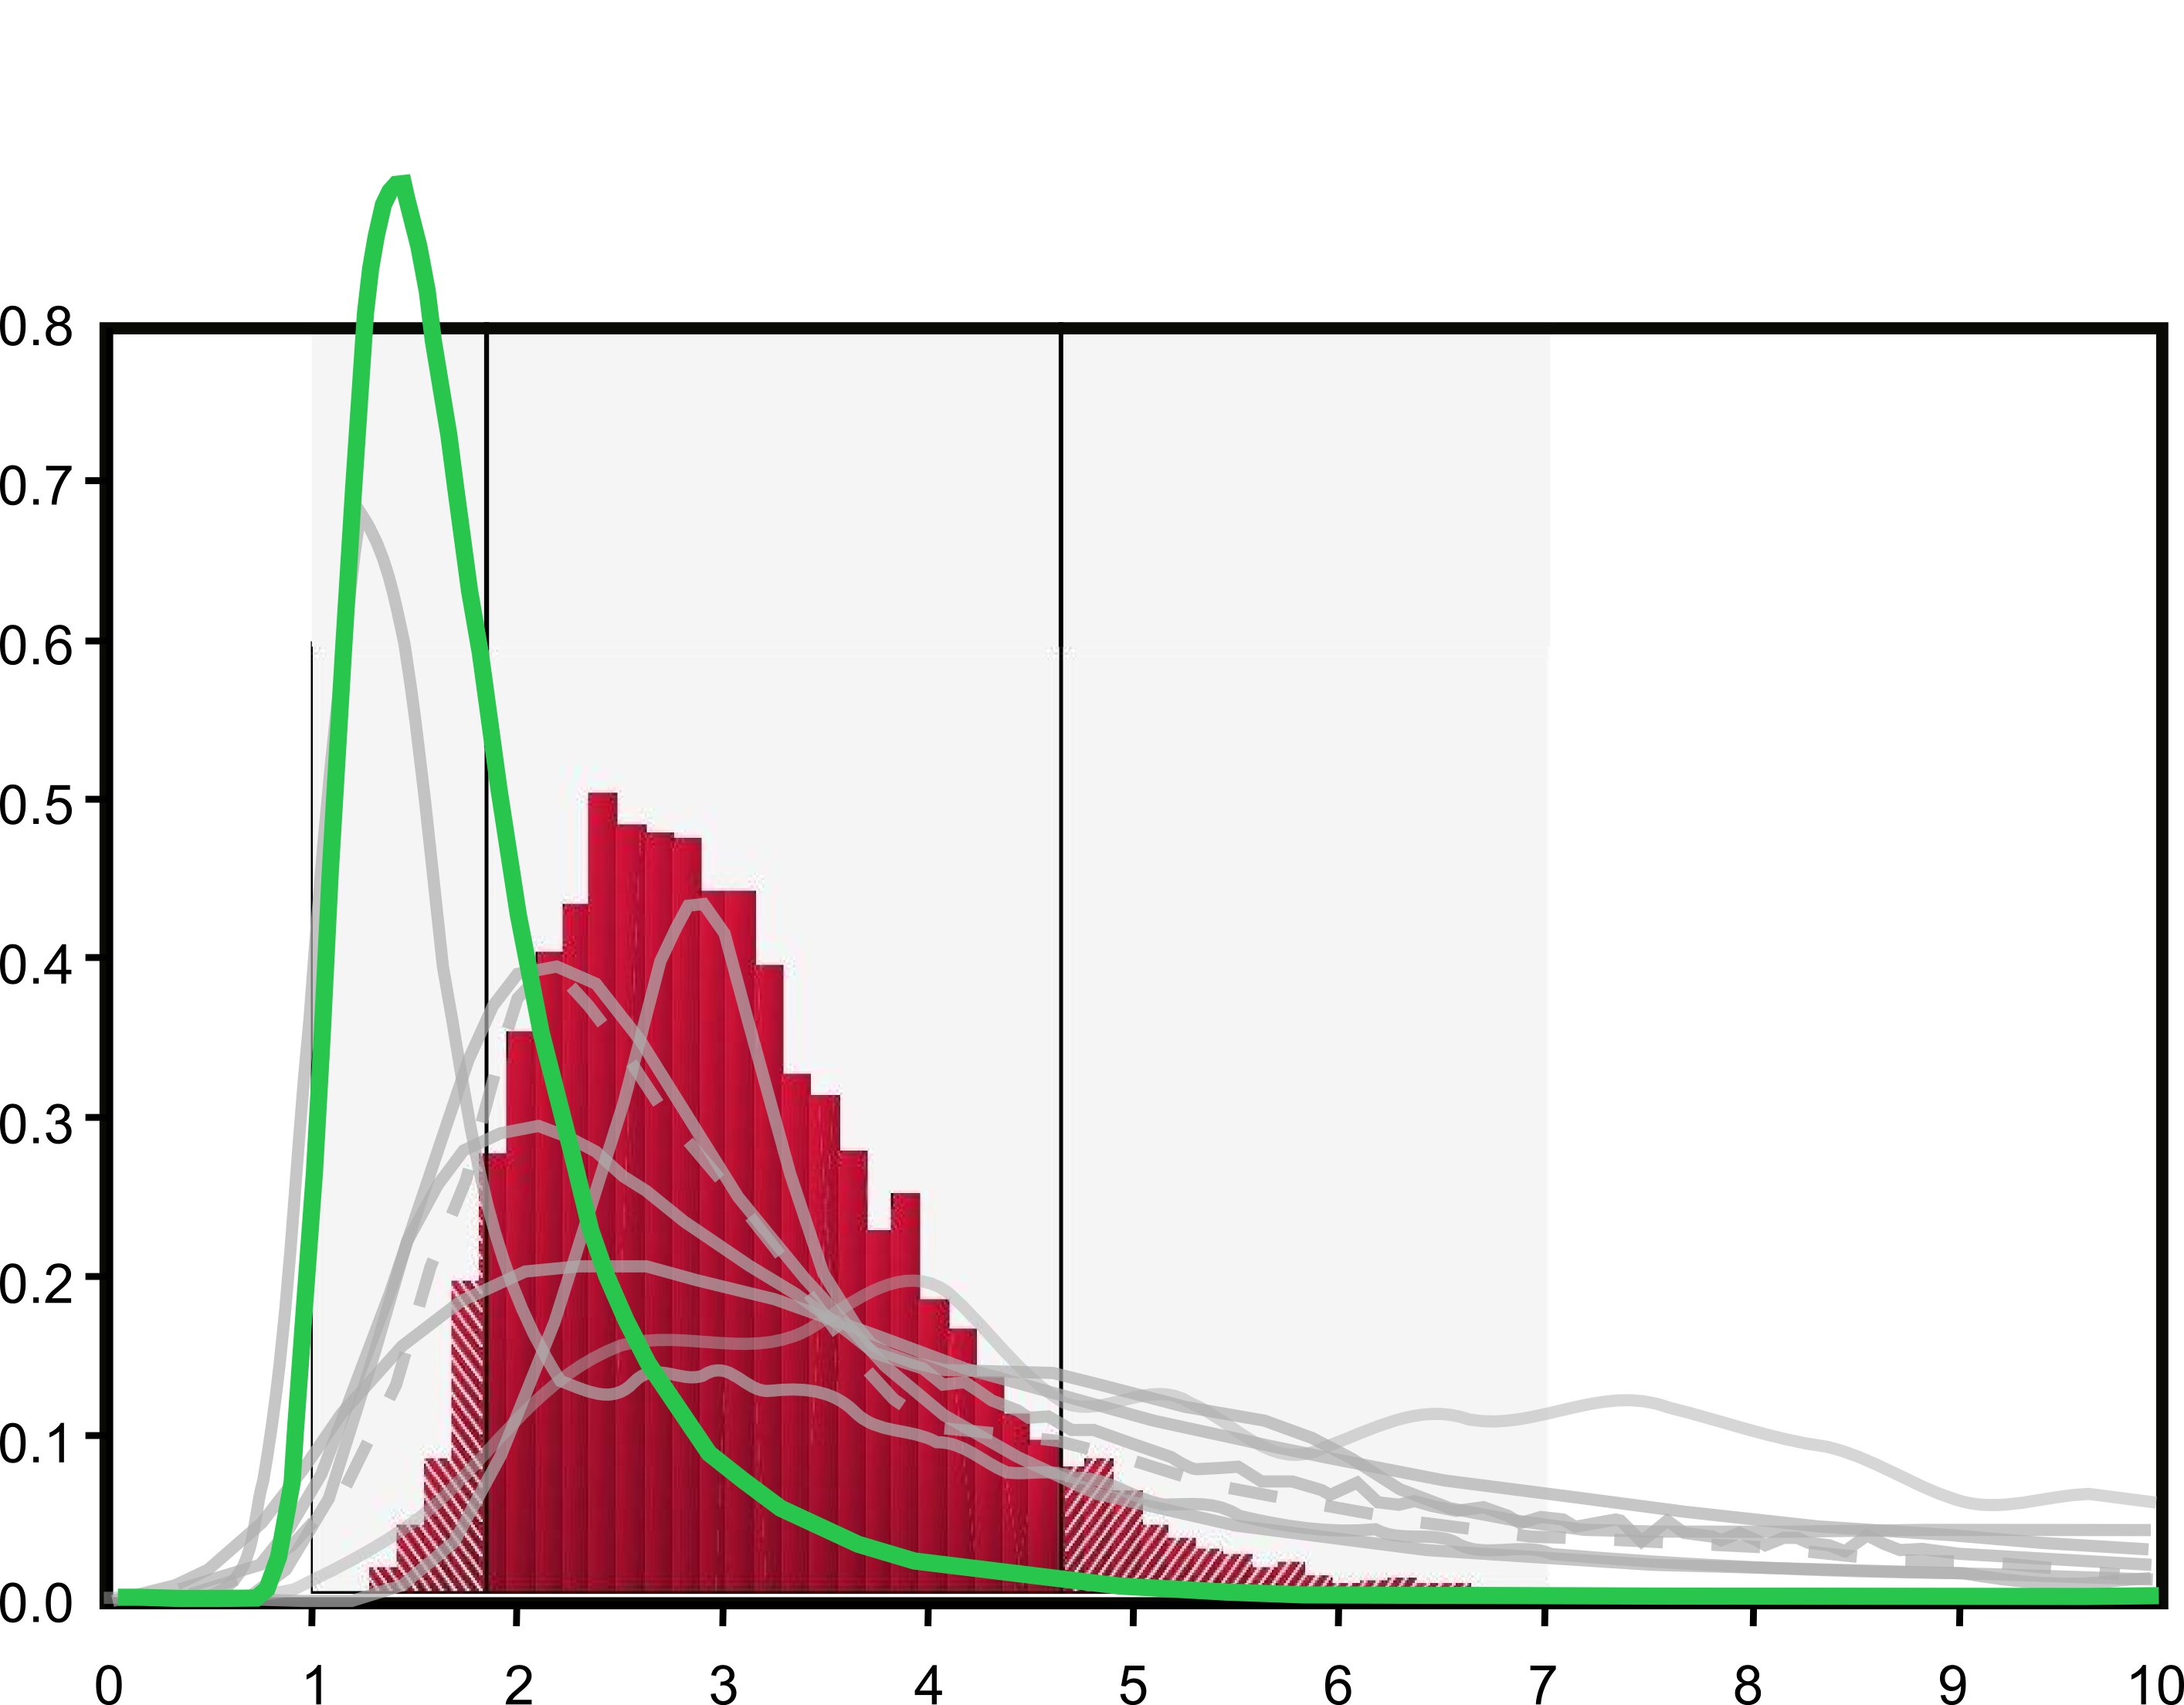
However, now we hit what I think is a snag: not all all of the estimates of climate sensitivity are equal. Most of the studies published in the IPCC report were either entirely based on climate model output or relied upon it to some extent. In fact there was only one exception: the paper by Forster and Gregory, which is the only wholly empirical study in the corpus. I'll highlight that one in this next diagram.
;) Now the picture seems to look rather less satisfying. We can see that empirical measurement is suggesting a low climate sensitivity with the most likely value at around 1.5°C. Higher values are driven by the modelling studies. Moreover, we can see that large ranges of values of climate sensitivity as implied by the empirical measurements of Forster and Gregory are not covered by the PAGE model at all. The IPCC's suggestion – that climate sensitivity is most likely to be in the range 2–4.5°C – is shown to be barely supportable and then only by favouring computer simulations of the climate over empirical measurements. This seems to me to throw lesson one of the scientific method out of the classroom window. And I really do mean lesson one:
Now the picture seems to look rather less satisfying. We can see that empirical measurement is suggesting a low climate sensitivity with the most likely value at around 1.5°C. Higher values are driven by the modelling studies. Moreover, we can see that large ranges of values of climate sensitivity as implied by the empirical measurements of Forster and Gregory are not covered by the PAGE model at all. The IPCC's suggestion – that climate sensitivity is most likely to be in the range 2–4.5°C – is shown to be barely supportable and then only by favouring computer simulations of the climate over empirical measurements. This seems to me to throw lesson one of the scientific method out of the classroom window. And I really do mean lesson one:
So an examination suggests that the values of climate sensitivity used in the PAGE model are highly debatable. But of course it's actually even worse than that (it usually is). Close followers of the climate debate will recall Nic Lewis's guest post at Prof Curry's blog last year, in which he noted that the "Forster and Gregory" values in the IPCC graph were not the values that were implicit in Forster and Gregory's published results - the IPCC had notoriously chosen to restate the findings in a way that gave a radically higher estimate of climate sensitivity.
So next I replot the IPCC figures, but using the real Forster and Gregory results rather than the "reworked" ones:
So now we see that there is very little overlap between climate sensitivity as used in the PAGE model and empirical measurement of that figure. If we look back to the IPCC narrative, their claim that
Values substantially higher than 4.5°C cannot be excluded, but agreement with observations is not as good for those values.
looks highly disingenuous. When they say the agreement with observations is "not as good", do they not mean that there is almost no agreement at all? And when they say that values above 4.5 degrees cannot be excluded, do they not mean that they must be excluded, because they are ruled out by empirical observation?
If Feynman is to be believed, the climate sensitivity values used in the Stern review are "wrong". Perhaps some of my more policy oriented readers can explain to me why the political process would want to use figures that are "wrong" instead of figures that are right.
Reader Comments (106)
It's a similar story to the previous thread.
The result of one paper (Forster and Gregory) is distorted and exaggerated by the IPCC.
Then that distorted exaggeration is distorted further by Hope and Stern.
"If Feynman is to be believed... " Feynman's right. That's a great 1-minute explanation of mathematical modelling!
Interesting comparisons, Andrew. The model is PAGE, not PAGES, and I am at Cambridge, not Oxford, but neither of these small errors affect your conclusions.
The values in the default version of the PAGE09 model seemed like a reasonable summary of the literature at the time. But one of the main reasons for constructing a model, rather than just writing a report, is that people who want to use different values for any of the inputs can do so and see how their input values affect the results.
@cwhope
[Thanks Chris - I could have sworn I'd fixed all the PAGEs/PAGE errors!]
"social cost of carbon"
Well, if you don't have it in the winter, you may freeze to death.
Thereby eliminating yourself from all social context.
But you can't use words like 'wrong' any more. It's like accusing an MP of lying, or using 'censor' when you mean 'redact'...
"people who want to use different values for any of the inputs can do so"
But only when the code is available. Some models are famously inaccessible.. :-)
The reason why the political process would want figures that are dubious or plainly false but scary is
"The whole aim of practical politics is to keep the populace alarmed (and hence clamorous to be led to safety) by menacing it with an endless series of hobgoblins, all of them imaginary."Henry Louis Mencken
This also explains why government, state owned broadcasters etc pushed all the hundreds of previous false "environmental" scare stories, from DDT through hundreds of different peak oil predictions to pollution killing us all by 42, global cooling, acid rain etc, all of which have proven overwhelmingly or entirely false
What I find incredible is the change in mind set among scientists, since the invention and development of powerful computers, and the resulting ability to produce complex models. Empirical verification or falsification of any theory was always considered essential. Then models became so massively complicated that they were mistaken for reality.
I remember computer modelling was just beginning to make its mark in 1969 in a particular field of solid state physics. Probably half the papers at one conference involved the new method. I remember the remark made by one young professor. He said that "we must never forget that modelling was rather like masturbation, pleasant but not the real thing."
Firstly, thanks to Chris Hope for responding to Andrew's post and making the point that people can play with the inputs to the model.
However, it would be most interesting to hear Chris' thoughts on the central point that the only "hard" data do not match the models' output....?
@Chris Hope - Your reply comes across a little as 'It doesn't matter if I picked an input for my model which is skewed, the model is still valid', whilst maybe accepting that there are other inputs which are at least as justifiable or better.
Assuming you have the resources to trivially re-run the model, what difference does an input distribution with corners at 0.9, 2.0, 5.0 make to the result?
I'm not sure I can do this myself, but I guess someone here can...
@Peter Stroud: Based on the many seminars on mathematical modelling that I attended over several decades, I can tell you that the natural response of (almost) all modellers to the question "Why should we prefer your model to its competitors?" isn't to refer to how well its outputs compare with the data. Rather, it is to say "Because it is more sophisticated."
Indeed. They should be forced to construct nomograms instead.
On a statistical point.
A right skewed distribution would imply mean is greater than median.
" ... people who want to use different values for any of the inputs can do so and see how their input values affect the results.
@cwhope Oct 1, 2012 at 11:03 AM | Chris Hope
..............................
No joking, it is common technique to look to extremes to see if one runs into argumentum ad absurdum, etc.
Can I take you up on your offer and ask for a quick run with just one central assumption changed? Simply, assume that atmospheric CO2 changes from now to 2100 do not affect the global atmospheric temperature. What, then, is the social cost of CO2 in the model version that you consider most reasonable in its other sections?
Thanks for the interesting and civilised discussion.
jamesp: I want models to be accessible too. I write mine in Excel.
MikeH: I'm not a climate scientist, so I tend to wait for IPCC reports before updating my default model; but as I said I'm quite happy for others to run the model with their own inputs.
Sean Houlihane: Indeed it is possible to run PAGE2002 with the distribution you suggest. It reduces the mean SCCO2 from about $85 to about $74 per tonne of CO2 (keeping all other assumptions the same).
dearieme: My aim is always to make the model as simple as possible while still saying something useful. It's an approach that Larry Philips at LSE calls 'requisite decision modelling'.
@cwhope
"triangular probability distribution" = triangle filter?
"...people who want to use different values for any of the inputs can do so and see how their input values affect the results."
Who are these people and why would they want to use values so 'different' from observed reality in deriving projections?
Geckko - correct. Which is probably why the mean rather than the median is the favoured output for climate modellers. Mention of the mode is also strictly taboo.
The IPCC models still use a CO2 residence time of 200years. Experiment shows this to be between 5-10 years, depending on the paper you consult. Using the correct figure removes any problem that CO2 imposes. But if you are paid to prove the CO2 problem then this would be counterproductive and loose you a job.
CO2 has never driven climate if you believe the data from observations. Again counterproductive if you are on this enormous gravy train.
What are on the X & Y axis?
(snip O/T}
"I write mine in Excel."
Poor Phil Jones...
:-)
OT but could be fun, anyone want £5k ?
http://www.truthmarket.com/campaign/Over-95-of-American-Scientists-Believe-Climate-Change-is-Real/179
Geoff Sherrington: What you propose would give an SCCO2 of zero; if an extra tonne of CO2 makes no difference to the climate, the extra damage it causes is zero.
However, trying to be helpful, I can run the PAGE2002 model with a climate sensitivity of 1 degC, and no other changes, and this gives a mean SCCO2 of just under $7 per tonne of CO2.
@cwhope
[Snip O/T]
If you changed the axis titles on the final graph, such that the vertical axis were labelled "chances of any given climate modeller losing his job", and the horizontal axis were labelled "degrees of warming predicted by that climate modeller", then the graph would be accurate as previously published, I think.
Andrew, what you are only just beginning to realise, is that like an iceberg, the nonsense we can see is just a small fraction of what is there.
As Paul Matthews said: "The result of one paper (Forster and Gregory) is distorted and exaggerated by the IPCC. Then that distorted exaggeration is distorted further by Hope and Stern."
In my experience, I suspect that when you look at Forster and Gregory, you will also find that they have vastly exaggerated someone else's work, who if you go and look, you will find that they have likewise vastly inflated the figures they use.
Indeed, in many instances, you can never find the "source" of some figures and I feel some people are citing work from people who have inflated figures from others who have inflated figures from others ... which finally come back to ostensibly the same person's calculation which they then precede to inflate for yet another round of ballooning BS..
In essence, it is just the simple mentality of the bubble market. Prices/figures rise because other people have high figures, which in turn causes those figures to be increased, etc. etc.
I don't even accept the premise of having a "climate sensitivity" number that people can bandy back and forth as if it was kind sort of a real-world constant that actually meant something useful.
If you look at the first IPCC figure at the top, only the authors of the model depicted by the black line are making it clear that they have even thought about the prospect of this mythical number wandering all over the shop.
[The authors of the purple line are trying to hedge their bets, in my opinion. Perhaps they are afraid of someone else at the IPCC becoming angry at the prospect of them telling us plebs just how futile the whole thing is. As for the other models...... well......]
Chris
Where do you stand on empirical vs modelling results as inputs to the policy process?
Presumably even Forster and Gregory's results are based on the sensitivity to CO2 in dry air. Ed Caryl's recent investigations with MODTRAN, reported on Tallbloke's Talkshop, suggest that in real (moist) air, the effects of doubling CO2 are negligible:
https://tallbloke.wordpress.com/2012/09/15/ed-caryl-modtran-shows-co2-doubling-will-have-almost-no-effect-on-temperature/
OK, it's a model, but it's one which has to work, given the people who built it.
Hats off to our host for challenging the most important assumption about man-made global warming in the IPCC account and doing so in the context of Stern and thus climate policy-making. And those seem to be good answers, Dr Hope (and I don't just mean your correction of university, important as that is!)
What Nic Lewis uncovered last July was of first rank importance. It's good to see it brought to more people's attention. It's vital that the IPCC should return to real, Feynman-taught science on the foundational issue (as the IPCC itself tells the story) of climate sensitivity.
Chris,
How about a negative social cost? There seems to be a major assumption without any realemprical evidence that a CO2 forced warming will lead to a social cost.
Maybe zero SCCO2 is in fact potentially the least biased assumption.
Chris,
I just wanted to expand on the social cost point.
Consider revealed prefences of society on aggregate and as individual choice agents. Across the developed world there is an overriding trend that retired workers tend to move to warmer climates:
The US - Florida
Australia - Queensland
Britain - Spain
What is important about pensioners is that their income is essentially not effected by choice of geography, so we see their revealed preferences.
To me that tells me that there is a social benefit (a negative "social cost") being revealed by choice. Warmer climate has a clear social value.
For now, I'll take the one that accounts for clouds.
Steve C: as Forster and Gregory's results are the only ones in AR4 based on empirical data, not the runs of General Circulation Models, and real-world air is far from dry, I can't share your assumption. The major point is that F&G's results, as originally stated, wouls imply no climate danger at all. As Geckko's just said, it could easily be that such a modest increase is entirely beneficial. So an arbitrary adjustment upwards was required, without stating that this had been done, in what is otherwise styled a review of existing literature. The most important thing wrong in AR4, to my mind, by a long chalk. And that's saying something.
Dodgy economic models
on a firm foundation of
dodgy climate models
is 21st century witchcraft.
End of story.
Chris -
The long tail in the climate sensitivity would seem to be the product of an assumption that the transient climate response response (TCR) and climate response time (FRT) are independent parameters. High climate sensitivities would arise from the combination of high TCR and long FRT. Have you examined the joint distribution of these parameters as extracted from models and/or observations?
I'd also suggest that the observational constraint on TCR, at the upper end, is stronger than the models' limit of 3 K.
Ah Feynman, a fine man. Experiment sure trumps models.
Excel was always frowned on as a calculational tool because of too many hidden assumptions and it could never be verified. Why use it?
Andrew: If you look at my early papers you will see that the climate part of the PAGE model is meant to be a very simple simulation of what the more detailed models show. But I don't think the modelling and the empirical results live in separate boxes. The modelling is informed by the data; it's just that it doesn't react to the short-term variability. But if, for instance, the global mean temperature in 2020 has dropped back to the 1960 - 1990 average, the modelling would have to react to that.
Geckko: Both Richard Tol and Rob Mendelsohn make similar arguments to yours, at least for small temperature rises. If the climate sensitivity is small, and the possible climate catastrophes turn out to be remote, the SCCO2 could be negative. Even in PAGE09, the bottom end of the range for the SCCO2 is below zero.
@cwhope
Richard Drake (1:52 PM) - My assumption stands corrected - thanks. I agree that empirical data trumps models every time, although those Modtran results are still interesting imho. I agree btw with anyone who sees no danger in increasing CO2, the benefits are obvious and the dangers distinctly not.
As for those errors in AR4 ... I think most of us just lost count or went to sleep before we got as far as working out which were most egregious! Well done. :-)
@cwhope
Where can we get copy of your Excel model?
"But I don't think the modelling and the empirical results live in separate boxes. The modelling is informed by the data; ..."
It doesn't seem like that.
Philip,
"Excel was always frowned on as a calculational tool because of too many hidden assumptions and it could never be verified. Why use it?"
When a naive science student, I was briefly appalled to learn that in Excel there was a function that allowed you to click-and-drag the individual points on a graph, and Excel would conveniently adjust the data in the spreadsheet for you.
Of course I quickly realised that it would probably be very convenient for some people.
The issue Hope must face is no professional scientist or engineer with advanced heat transfer training can accept the childish mistakes in heat transfer in the climate models, for example to assume IR emitted from the Earth's surface through the 'atmospheric window' magically returns from Top of Atmosphere when there is no physical mechanism for it to occur.
These models get the positive feedback from a 'perpetual motion machine of the 2nd kind', 40% increase in energy hidden by exaggerated cloud cooling. The mistakes are compounded by believing pyrometers measure a real energy flux when it's really the Poynting vector, a measure of temperature.
michael hart: Precisely. That's why it is surprising that it seemed beyond the capability of Phil Jones. It was an ideal tool for his missing data studies.
PS I'm glad Caryl's MODTRAN data are getting credence. My background is Metallurgical engineering were we design heat treatment processes and furnaces using real GHG emissivity, and these MODTRAN data originate in Hottell's work of the late 1940s, replicated by Leckner in the 1970s.
The real GHE can only be the reduction of emissivity of the Earth's surface by thermal emission from atmospheric GHGs. The Aarhenius idea is total bunkum so are the models
Chris,
How can your models ever match the past if those numbers (past temps) are themselves continuously being changed without notice?
Mailman
Rob Schneider: email me cdothopeatjbsdotcamdotacdotuk (replace dot and at with symbols)
michael hart, Phillip Bratby: I don't use any of that fancy interactive pulling around of curves stuff in Excel, just the standard computational functions; if they don't work I think we have more to worry about than some errors in an integrated assessment model.
@cwhope
Chris Hope: I think you miss the point about using (and allowing others to use) an unconfigurable software package that is totally open to abuse and misuse.
How cosy. No bias there then.
Can I suggest, for Chris Hope's benefit and more generally, that there are two major digressions in play by now on this thread:
1. Excel is fine as long as the formulas and Visual Basic are included. (In an ideal world we would be dealing with open source all the way down, as in stats language R, but used judiciously, as it sounds Hope has done, no problem.)
2. The key thing for someone like Chris to grasp is that the IPCC in playing fast and loose with Forster and Gregory is undermining fatally its own story, in which high climate sensitivity is the foundation for all else. No need to delve into that vocal minority that say that there are other childish mistakes. The IPCC has sawed off the branch it was resting on - so it matters much less whether other factors would have meant that the branch would have broken anyway, before long.
I'm not saying this to reduce discussion and debate elsewhere - all power to Tallbloke and those doing experiments with MODTRAN, in the non-Feynman sense. But it's important not to dilute Andrew Montford's powerful critique above, in which the one minute of Richard Feynman will, as Paul Matthews said. teach you more about the limits of modelling than many hours from many others.