


Discussion > Does Climate Science Exist?
Aug 20, 2015 at 8:58 PM Entropic man
Thanks for all that. Scotch on the rocks?
 Martin A
Martin A
I am quite happy to refer to SandyS concept as a hypothesis.
I tend to associate "claim" with Anthony Watts. His blog posts reporting on scientific papers often say that the paper " claims" something. ☺
You are getting very tangled up in the concept of a hypothesis as a logical construct and focusing too much on semantics.
Think of a hypothesis as a tool. It is used to bridge the gap between theory and reality, allowing you to design experiments and predict the behaviour of a system.
Just as you would prefer to use the best tool for the job, a scientist with a choice of different hypotheses will tend to use the one which best reflects reality.
Given a choice between the CO2 increase global warming hypothesis and the natural variation global warming hypothesis, the former is a better fit to reality than the latter.
When you do the temperature, energy flow and energy content calculations the CO2 hypothesis produces a better fit between theory and observations than the natural variation hypothesis.
Neither is perfect, but you use the better tool.
Entropic man
Entropic man
You'll have to remind what that was.
SandyS
Martin A
"I'd like another slice of rhubarb tart"
Nullis in Verba
I am having trouble with your use of "validate" when applied to science. When I look up definitions it refers to whether products or software meet their specifications, which is engineering usage.
Perhaps you could give me examples of validation of scientific hypotheses in the laboratory and in the field.
I am particularly interested in how a statistician such as yourself would validate a model of the effect of natural variation on a planetary climate system, particularly within the current constraints on data collection.
Entropic man
SandyS
Somewhere back along the debate you expressed an opinion that natural variation was sufficient to explain the observed changes in climate. Hope you don't mind me borrowing it.
Entropic man
Looks like it was a treble.
michael hart
Nullis in VerbaI am having trouble with your use of "validate" when applied to science. When I look up definitions it refers to whether products or software meet their specifications, which is engineering usage.
Perhaps you could give me examples of validation of scientific hypotheses in the laboratory and in the field.
I am particularly interested in how a statistician such as yourself would validate a model of the effect of natural variation on a planetary climate system, particularly within the current constraints on data collection.
Aug 20, 2015 at 10:26 PM Entropic man
Mr man, are you simulating stupidity or is it genuine? Someone said you have said that you have statistics training but that hardly seems possible.
The key point of Nullius's comment was that a validated model for the statistics of climate variation is not avaialble.
The normal process for validating a time series model is to perform statistical analyses (at the elementary level power spectrum estimates or autocorrelation function estimates, measures of nonstationarity, and so on) on the observed time series and then to compare the empirical results against what they would be if the model were correct. A close match validates the model.
The fundamental problem is that large amounts of empirical data are needed for such tests. As you have yourself implied ("particularly within the current constraints on data collection"), in the case of the climate system, the data available is minuscule compared with what would be needed for even a crude validation of a statistical model. So a validated model appears unobtainable.
Now stop baiting Nullius with your silly questions.
Nullius in Verba's Mum
michael hart
Yes. As I've said before, it's a good rule not to touch a keyboard connected to the Internet if you've been drinking.
Even (especially?) for bidding on Ebay.
A friend who sells stuff on Ebay sets the end time for his auctions around 11:45pm on Saturday, on the assumption that an alcohol-fueled aggressive will-to-win can result in bids that the same person would never make at 6pm on Monday.
Martin A
Entropic man
No, quite happy for that to be the end point of any discussion. I still hold to that opinion, I have a list of about a dozen things in my head which lead to that conclusion, thus far no one has ever pointed me to anything to make me change my mind.
Martin A
For that reason I never bother bidding on stuff that has an auction end late Saturday night.
SandyS
SandyS - that's interesting.
I guess you are correct not to bid on auctions ending late Saturday night if a similar item will show up again soon.
But if it is something that comes up once in a decade (or once in a lifetime) then I think you should bid the maximum sum you are willing to pay (via a sniping service so you don't unnecessarily give information to the competition or encourage them to increase their existing bid) irrespective of the end time of the auction.
There are a couple of interesting books on the theory and practice of Ebay bidding . One is
Kenneth Steiglitz: Snipers, shills, & sharks: eBay and human behavior, Princeton University Press, 2007.
[In the 1970's he published some wonderfully original papers on signal processing.]
Martin A
"Why do you need this to calculate the probability that the two ends of a time series linear regression are different?"
A statistical model asserts the probability of any given set of observations occurring. You can't calculate probabilities without one.
For example, one simple model assumes that a set of observations consist of a constant plus independent outcomes of a normally distributed random variable with zero mean and fixed variance. This means that the probability of a single observation is proportional to exp(-(x-C)^2/v) and the probability of a particular sequence of n observations is the product (because of independence) of n such terms. That's P(x1,x2,x3,...) = K exp(-(x1-C)^2/v) exp(-(x2-C)^2/v) exp(-(x3-C)^2/v) ...
Because of the properties of exponentials, we can replace that product with a sum. P(x1,x2,x3,...) = K exp(-((x1-C)^2/v + (x2-C)^2/v + (x3-C)^2/v + ...)) and the series inside the exponential is just a sum of quadratics in C. Adding up any finite number of quadratics yields a quadratic, so we can simplify it to exp(-(p C^2 + q C + r)/v for some set of constants p, q, and r that depend on the observed data.
This quadratic has a minimum, at which exp of minus it is at a maximum, and we can say that the observations we actually observed would be at their most likely if C takes this value. The width of the quadratic tells us how accurate this estimate is. That's pretty much what the statistics software is doing.
But this is only true if the original probability model is true! If the errors are not independent, then we can't work out the joint probabability as just the product of the individual terms. If the errors are not Gaussian, then we can't use the exponential trick to turn a product into a sum. If the variances are not the same, we cannot add up the quadratics as we did. If there isn't an underlying constant, the whole basis of the probability calculation is invalid, and the numbers generated by plugging observations into the algorithm are a nonsense. It's certainly very easy to do, but we have no reason to think this value of C is more likely than any other, because the calculation depends on false assumptions.
The problem is that in schools they tend to teach to the test. So you read the textbook, and there are always a bunch of caveats and conditions at the start of the theorem, but students ignore those because they know perfectly well that all the exercises at the end of the chapter are going to start "Given that the errors are iid Gaussian, calculate..." because there's no point in asking questions the student's can't answer. They teach a method, and then give examples to which the method is applicable to practice on. So all you need to know is the method. You don't need to check or even remember the conditions, because in the exam they'll always be valid.
That's good logical reasoning, and very sensible, so long as you don't make the mistake of thinking it works in real life.
The other problem is that in school they tend to use the "telling lies to children" technique. When explaining the world to toddlers adults tend to make up something that's not true but is simple enough for them to understand. Later at school they tell them something a bit less simplified and a bit more accurate, but which is still wrong. At college they give them something much more complicated and much more accurate. Then at university they reveal that was all lies too, and the real story is even more complicated. Then as a postgrad you discover how astoundingly over-simplified undergrad explanations really are, and so on. Finally, you discover that actually at the most fundamental level we've no real idea how it all works, and we're all just winging it.
However, very few people ever get to the end of this particular road, and most drop out somewhere along the way. But wherever they drop out, they remember the last thing they were told as the absolute truth. That's how it was presented.
And scientists are no exception. Scientists studying other subjects need a bit of maths and statistics, but they don't have time for an in-depth study if they're to learn everything they need to know in their own subject. (Nor would most students tolerate it. Maths is hard.) They step out before reaching the end of the road, too.
"I am having trouble with your use of "validate" when applied to science. When I look up definitions it refers to whether products or software meet their specifications, which is engineering usage."
The terminology is based on the engineering usage. When you build a model you have to also determine how accurate it is and under what conditions - which may be considered its specification. Verification is the process of measuring the accuracy of a model - in the case of statistical models, of their ability to make probabilistic predictions. Validation then compares that specification to the requirement, to see if the model is accurate *enough* to solve our problem.
So you can test how accurately Newtonian mechanics can predict the orbits of planets and space probes. Accurately enough, for example, to predict the recurrence of a comet to within a few months in 75 years time. Then when you have an engineering or scientific problem - how to send a probe to Jupiter, for example - you can say whether Newtonian mechanics is a suitable tool, or whether you need something more precise.
Any model, no matter how stupid or inaccurate, may be acceptable for problems with a sufficiently lax requirement. The "throw it in the general direction of the target" variety of mechanics is likely sufficient for getting a screwed up ball of paper into the bin, and so for this particular problem is a validated theory of mechanics. We know how accurately we can throw, so we can predict the maximum range at which we'll be successful. It probably won't do for a Jupiter probe, though.
So for the climate change attribution problem, you have to first have a model that tells you the probability of any given sequence of temperatures, you have to determine how accurately that model can make predictions of future sequences (verification), and then you have to assess whether that accuracy is sufficient to separate the hypotheses we're trying to test (validation).
Nullius in Verba
Which nicely sums up the hurdles climate models fail.
michael hart
EM You say at Aug 20, 2015 at 7:41 PM
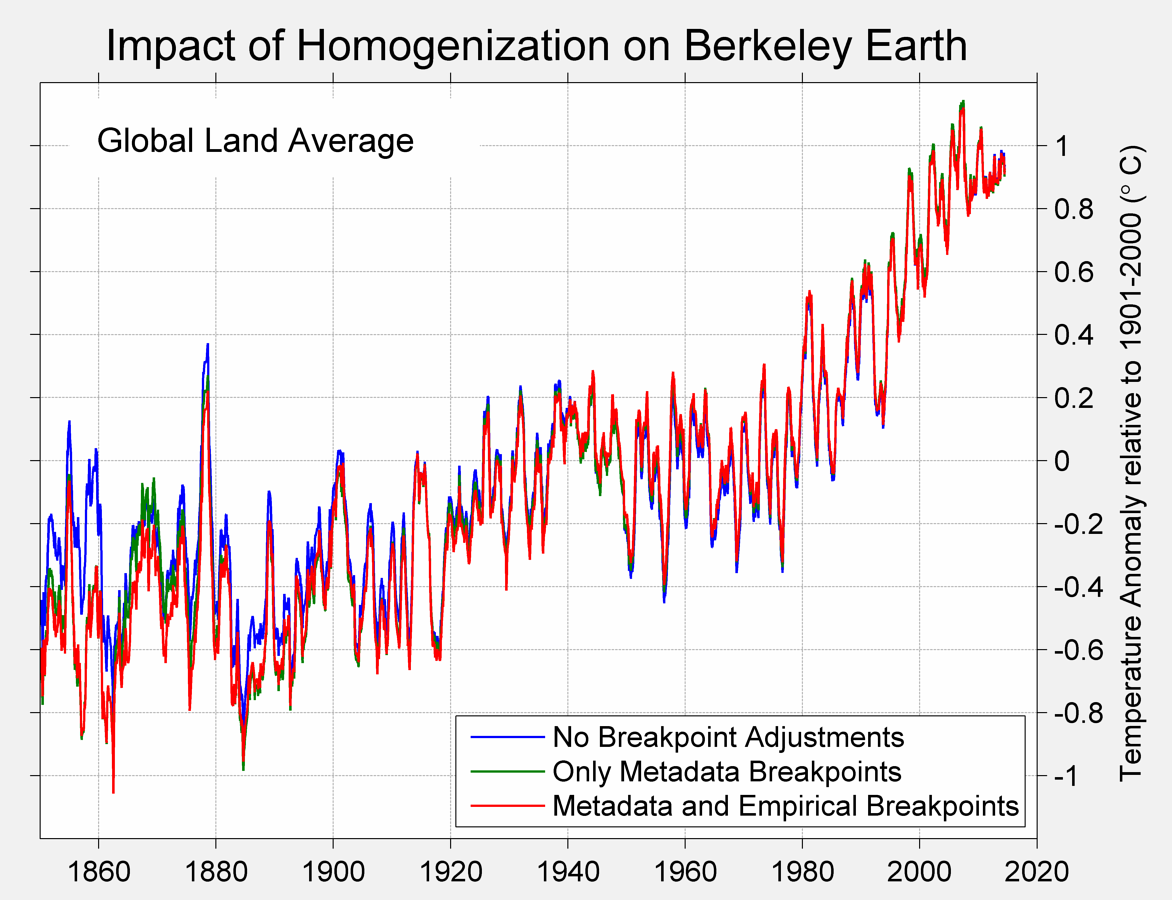
If homogenisation were a problem there would be significant differences between the raw and processed data. That turns out not to be the case.
The graph is from Berkeley Earth. Sure enough, after 1920 the raw data average is virtually identical to the data after adjustments. To understand why the adjustments make very little difference you need to read the paper Berkeley Earth Temperature Averaging Process.
You will find that BE
- to average across the land area use a linear least-squares estimation algorithm known as Gaussian process regression or Kriging.
- assumes that large random deviations of individual or clusters of stations are assumed due to measurement biases.
- gives a "perfect" station 26 times the weighting of a "terrible" station.
As a result real local variations in trend are treated in exactly the same way as measurement biases. A clear example is in Paraguay at the end of the 1960s. A fall in temperatures of one degree over three years was common to at least eight stations, but not to the whole of the country. That is strong evidence is the fall was both real, but out of step with the trends in the wider area. But in the global average graph the raw data and the adjustments will carry 1/13 of the weight those of typical temperature stations and 1/26 of a temperature station that conforms to the average. The graph does not visually highlight issues I have raised, but understanding what makes up the figures does.
This raises an important point about the theme of this thread - Does Climate Science Exist?
It will never exist so long as people take pretty graphs or statistics without first understanding them. Splitting hairs or spitting feathers or diverting in other directions are distractions from knowing the limits of the available data and the limitations in interpretations of that data. Otherwise when we think we are comparing theory to the "reality" of the data we are kidding ourselves.
Kevin Marshall
Nullis in Verba
Thank you for a very clear explanation.
As an old teacher I have been telling "lies to children" for decades. I am well aware of the technique's usefulness and its limitations.
"Finally, you discover that actually at the most fundamental level we've no real idea how it all works, and we're all just winging it."
As an old biologist I used statistical tools to help with experimental design and to judge the quality of the results and the validity of the conclusions. As you say, I learned enough to use them, but not what went on under the hood. If I had a problem choosing a technique or interpreting its output I asked a statistician. Much of our experimental work was designed to generate two frequency distributions at different times or to compare a treatment with a control. Then we used an appropriate test calculate the probability that any difference between their means was due to chance.
What I do not recall being told that, at the sample sizes and levels of variability seen in biology, any statistical analysis was meaningless. It was made clear that larger sample sizes and less variable data gave greater confidence in the validity of conclusions drawn from patterns in the data, because standard deviations and confidence limits were tighter. Note that almost our replicated data followed normal distributions, or was accepted by ourselves and our statistical advisors as a close enough approximation.
I find it difficult to reconcile my own experience with your description of the collected climate data as non-gaussian Most temperature, rainfall and event frequency data show a visual similarity to a normal distribution when plotted as a frequency distribution. Whoever plots the graph usually includes SD information too. The sample sizes are also large, much larger than we could usually manage Am I missing some subtlety here?
"you have to first have a model that tells you the probability of any given sequence of temperatures, "
You have that. CMIP5 is a physical model used to project future temperatures. The physical equations are constant and albedo, solar insolation, rate of CO2 accumulation etc can be vared. The resulting ensemble gives a range of possible futures, with confidence limits.
"you have to determine how accurately that model can make predictions of future sequences (verification),"
Compare the CMIP5 ensemble with hindcast data and data collected since the 2008 model run dates. The measured data is within the confidence limits of the ensemble. Some individual runs have natural variation which closely matches the post 2005 observed variations( which were near the bottom of the forcing range expected when the models were compiled). Those runs also have a closer match to post-2005 data. Is this not verification?
"you have to assess whether that accuracy is sufficient to separate the hypotheses we're trying to test (validation)."
CMIP5 runs with typical variation and constant CO2 produces short term variation typical of the short term variation seen in the record, but without the long term trend. Whether the long term trend is significant, and is significantly different from the constant CO2 null hypothesis are the big questions.
Those working in the field, and the statisticians advising them, have done their analyses and decided that the observed temperature trends are significant and fit the model predictions.
You and Doug Keenan regard these questions as impossible to analyse.
Unfortunately out there in the day policy makers have to choose between these alternative views. I note that after meeting Doug Keenan the Met Office have decided to go with their own advisers.
Entropic man
Kevin Marshall
The questions the policy makers ask are:-
Are temperatures changing?
Why?
Is there a problem?
What are our options?
The processing of raw data is intended to generate a useful temperature record from a necessarily limited and imperfect sample, in order to answer the first question. From a statistical viewpoint it is possible and necessary to design adjustment algorithms, as BEST, GISS and others have done. One needs to know the quality of ones data.
The variations due to sitting changes, time of day changes etc turn out to be much smaller than natural variation and the long term trend. Adjustments improve the quality of the data, but only make a small difference.
From a practical viewpoint, the raw data and the processed data are almost identical.
"A difference which makes no difference is no difference."
Entropic man
EM - after all the stuff you told me about the advances in electrical science since the time of Volta I still was not sure if you had understood the point I was trying to make. You told me I was getting too hung up on terminology or something but without saying whether you had understood my point.
I felt that if you had thought it worth posting
"If P then Q" must be shown to be false.You might do so in two ways.
Firstly by demonstrating that the mechanism linking cause and effect is not sound (If P not always Q).
Secondly by demonstrating that another cause better explains the observations (If R then Q).
then you might also think it would be worth responding to my explaining why your "secondly" is a fallacy. ie a new "better" (=sounds more convincing?) hypothesis does not constitute a *proof* that the old hypothesis is false.
Martin A
Entropic Man when you say
From a practical viewpoint, the raw data and the processed data are almost identical.
"A difference which makes no difference is no difference."
You are making a value judgement based on very limited knowledge and understanding of the data. In my view any academic discipline should try to achieve the best understanding of the subject area possible. For any empirically-based discipline that means understanding the data. Land temperature data is of very poor quality, and very limited in extent. But quality and extent both diminish the further back in time one goes. With homogenisation in where real trends vary from place to place, more spatially limited the data, the greater that any average real "trend" will be smoothed. In particular the relative estimated size of the early twentieth century warming to the late twentieth century warming will be impacted. This is a testable hypothesis. As a consequence the estimated proportion of the recent warming that is human-caused warming will be impacted as well. It is not a closed question of "Is there a problem?", but one of magnitude.
The policy issues are not closed questions either. They include questions of theoretical and practical effectiveness. From a moral standpoint I believe that policy is only justified if there is a reasonable expectation it will make a positive difference. All what I have found is woolly thinking all round, grossly exaggerating the likely impacts of global warming, ignoring the harms of policy (particularly on economic growth in developing countries) and pretending that recycling every scrap, flushing the lav less often and driving a Prius will "save the planet".
Kevin Marshall
Are temperatures changing? Not really.
Why? We have no real idea.
Is there a problem? Not really.
What are our options? Why worry…? Spend vast amounts of other peoples’ money to ensure that I will go down in history as the saviour of humanity – or, if that doesn’t work, I and my friends will get very rich, indeed.
Radical Rodent
As for “…raw data and processed data being almost identical…” Are you aware that much of the raw data was showing a definite cooling trend, yet the processed data now shows it to be warming? (Have a look at Jo Nova’s site for more info – if she is not qualified enough for your sensibilities, have a look to Jenny Marohasy.) Quite where you see these different data as “almost identical”, I have no idea.
Radical Rodent
Aug 22, 2015 at 7:00 AM | Radical Rodent
My little mental list is, not always in this order. GAT = Global Average Temperature (whatever that means) The list does vary a bit depending how I feel.
Have the:-
1. Has the GAT ever been higher with lower levels of CO2 than currently?
2. Has the GAT ever been lower with lower levels of CO2 than currently?
3 .Has the GAT ever been higher with higher levels of CO2 than currently?
4. Has the GAT ever been lower with higher levels of CO2 than currently?
5. Have there been more rapid increases in GAT than recently (last 160 years) experienced?
6. Has there been more Arctic Sea Ice than current levels with a similar GAT?
7. Has there been less Arctic Sea Ice than current levels with a similar GAT?
8. Have there been extremes of weather in the past similar to those we worry about today?
9. Have global sea levels been higher than current levels?
10. Have the global sea levels been lower than current?
11.Has the tree line been further North/South?
12 Has the tree line been at higher altitudes than current?
13 Have advancing glaciers been considered a life threatening problem?
14, Have there been more rapid changes in global CO2 levels than current changes?
As far as I can tell the answers to all these questions is yes, no one has ever pointed me to contrary evidence. All of this has happened before the industrial revolution and some after. So why does anyone think that most, if not all the Climate Change is caused by natural factors?
This is why I think that we're worrying about, and spending billions trying to control natural variation.
SandyS
EM
You are mistaken.
Policy makers were not asking any questions about temperature at all. Go back to any time prior to 1980 and find any instance where government or civil servants were expressing any concern about climate.
What happened was that those who became known (by me) as Climateers approached government dangling a bright shiny ball on the end of a chain and said, "watch this carefully" and when their eyes glazed over they said "the temperature is increasing; it is dangerous; here is what you need to do about it".
You must have been in the room at the time because they evidently hypnotised you and the other camp followers as well.
Fortunately, as in The Day of the Triffids, some of us were asleep at the time. And equally fortunately we have now woken up.
Mike Jackson
SandyS
Having played with very simple chaotic systems and seen the varieties of incomprehensible behaviour displayed when left to their own devices with no external inputs, I've been puzzled why it should apparently be taken for granted that there has to be an "explanation" for every change (or, in the case of "the pause", lack of change) in the climate system.
You have a system which is chaotic (because of the chaos involved in convection if nothing else), with complicated interacting dynamics on timescales from minutes to millenia, and with an ongoing supply of energy to keep things bubbling along. My own expection would be that its behaviour would be 'fractal' in nature, with random and unpredictable changes on all timescales.
Science of Doom discussed chaos in the climate system not long ago. He pointed to a paper describing how an abrupt climate change was observed in a model simulating climate, with no external factor to have provoked it.
(...) Here we report on a spontaneous
abrupt cooling event, lasting for more than a century, with
a temperature anomaly similar to that of the Little Ice Age. The
event was simulated in the preindustrial control run of a high-
resolution climate model, without imposing external perturba-
tions. (...)
I get the impression that the authors were surprised to see a "little ice age" type of event in their simulated climate with no external changes (sun, aerosols, ghg) to cause it.
Martin A
Martin A
That's an interesting link.
Even if the climate moved "outside" what we think it has done previously it doesn't follow that it was caused by anything we have done. We have an almost childlike predisposition to blame ourselves; just like children hiding when a policeman comes to the door because they are being blamed for something.
I do have a feeling that most natural processes have what might be described as a cyclic element in that similar, but not identical, conditions have occurred in the past and will change to another previously experienced situation. Hot - cold- hot, boom-bust-boom and so on.
SandyS
I agree with both of you.
Given that climate is chaotic, something that even the IPCC specifically admitted in the days before it became "the greatest money making scam challenge facing mankind in the history of the world", why should one necessarily be surprised that at any given time all its chaotic bits would combine to throw up a Little Ice Age or a Roman Warm Period or a few decades with lots of hurricanes or no hurricanes or more ice or less ice, "just for fun", as it were.
Add in the fact that we have only been able to get a proper handle on this whole business since less than 200 years ago which isn't even as far back as the middle of the last Warm Period and I repeat what I said elsewhere yesterday "WTF is their problem?"
On the basis of the cock-up/conspiracy theory, natural variation is going to win out over the puny efforts of mankind and his trace gas at least nine times out of ten.
Mike Jackson
If you have to ask, you'll never know.