


Discussion > Does Climate Science Exist?
What if the formal logic of “if P then Q” becomes something more like “if P then not necessarily Q”? This IS what has happened; observations have shown a more or less linear rise in CO2 concentrations in the atmosphere, yet the temperatures have not been quite as unremittent, rising for 30 years, falling slightly for 35 years, then rising again (and sending so many into a tail-spin of panic) for about 20 years before plateauing again, for over 18 years, so far (acknowledged by most, yet there are still some who remain in denial about it).
“Ah, but,” I hear you say, “that is because of natural variations preventing the temperatures from rising.”
To which the only riposte has to be: “Could it not be possible that the observed rises themselves are but a manifestation of natural variation?”
 Radical Rodent
Harold W
What is this nonsense? Do your own research!
You might start here.
When you have done so you will find that the temperature outputs for CMIP5 are air temperatures, 5' above the land or sea surface.
Satellite Lower Troposphere measurements are based on microwave emissions from oxygen in the lowest 5-7km of the atmosphere.
Radiosondes measure a temperature profile from the surface to the altitude at which the Neither are dircetly balloon bursts in the lower stratosphere.
Neither are directly comparable with surface temperatures, model or observed.
Entropic man
I would like to understand why a temperature anomaly at 5-7Km would vary wildly from a temperature anomaly at 1.5m. If you're measuring anomalies you aren't measuring absolute temperatures, so while I accept the temperature at 6Km is going to be around 12C lower than at ground level, what is it that makes the measurement of anomalies cooler at 6Km different from the measurement of anomalies at 1.5m?
geronimo
"You have just demonstrated why the formal logic of propositional calculus should not be applied to science.It is too simplistic, which is why higher-order logical systems were developed."
Tosh. This is standard "Philosophy of Science 101" stuff. The fallacy of confirming the consequent dates back to Aristotle, and the principle of falsification is pure Popper.
Higher order logics don't help you - they're more expressive, and can express more complex ideas, but where they overlap they agree entirely.
"The CMIP5 models apply " If P then Q" to projected temperatures. They are based on the same physical model and data as HadCRUT and their output is surface temperaures."
More tosh. CMIP5 is a collection of computer models. HadCRUT is a weighted average of empirical data. The physical models are entirely different, and indeed of an entirely different type.
"This is the linear trend for GISS from 1998 to date. I have included 95% confidence limits."
How did you calculate the confidence bounds? Because if you used the built-in method that comes with most statistical software, it's only valid if the errors are additive, independent, identically-distributed Gaussian. Because the assumption isn't true for temperature data, the confidence bounds are invalid.
To calculate confidence bounds correctly, you need a validated statistical model of the natural background variation, which so far as I am aware nobody has been able to produce. Are you claiming to have one?
Nullius in Verba
" it's only valid if the errors are additive, independent, identically-distributed Gaussian. "
Somewhere previously in this thread (Jul 9, 2015 at 8:50 PM) Entropic Man claimed to have training in basic statistical methods (and a branch of science other than physics) and thus to be qualified to be "competent to judge" (presumably on matters to do with global warming).
(Shortly afterwards he informed me that I was incapable of doing specific heat calculations that required no more than O-level physics and that I did not know about the structure of caves - the sort of knowledge that an eight-year old who has visited Cheddar caves knows by heart.)
At least a couple of time I've pointed out on occasion to EM that multiplying a standard deviation by a standard coefficient to get a 95% confidence interval produces bollocks if the distribution is not known to be Gaussian.
Only to be met by "the literary equivalent of blank looks" (™ Entropic Man) and then to see further statements about his having computed confidence intervals.
Was EM asleep in his basic statistics training, or was the teacher a biologist (or whatever) and out of his depth (as EM evidently is) with even the basics of the subject?
Martin A
Thanks for your response, EM.
You claimed that the "models" curves in Spencer's graph are surface temperatures. As he compared models to satellite / radiosonde observations at altitude, it would be inappropriate to use surface temperatures in context.
From your response, it seems that your evidence for this proposition is that "the temperature outputs for CMIP5 are air temperatures, 5' above the land or sea surface." Well, 2m temperature certainly is *an* output, and the one most commonly used. But hardly the only output. From the CMIP5 standard output description:
In CMOR Table Amon: Atmospheric 3-D fields on standard pressure levels, except 4 cloud fields which are on model levels.
Include the following mandatory pressure levels (which are available from all available reanalyses and CMIP3): 1000, 925, 850, 700, 600, 500, 400, 300, 250, 200, 150, 100, 70, 50, 30, 20, and 10 hPa; Also include, when appropriate, output on the following additional pressure levels: 7, 5, 3, 2, 1 and 0.4 hPa.
...
[Table follows. One row is]
(priority) 1
(long name) Air Temperature
(units) K
(output variable name) ta
(standard name) air_temperature
...
So it appears that temperature at altitude is available. That seems to dispose of the argument that Spencer's curves *must* be surface variables because "the temperature outputs for CMIP5 are air temperatures, 5' above the land or sea surface."
Do you have any other reason to suspect the model curves are based on surface variables? For example, "the curve matches what one obtains by getting surface variable X from KNMI, limited to the tropics." Or "the curve matches this other one from Spencer which he says is surface temperature". Lots of possibilities. But please, no "it must be surface temperature because that's what models provide." They provide a wealth of output.
HaroldW
Martin A
Your cockerel example illustrates my point. (....)
"If P then Q" must be shown to be false.You might do so in two ways.
Firstly by demonstrating that the mechanism linking cause and effect is not sound (If P not always Q).
Secondly by demonstrating that another cause better explains the observations (If R then Q).
This is how science operates. It is known in formal logic as modus tollens or "denying the consequent"
Aug 16, 2015 at 7:57 PM Entropic man
________________________________________________________________________________________
(recap): My neighbour's cockerel used to boast that it was because of his crowing that the sun rose each day.
Asked to prove it, he crowed at 6am and, soon after, the sun rose.
A sceptical onlooker said that that proved nothing at all; it was what logicians call the fallacy of "confirming the consequent". A real test would require that the cockerel did *not* crow one morning. If the sun then *failed* to rise, that would be evidence that his crowing did indeed cause the sun to rise.
However, the cockerel was having none of it. "You have just demonstrated why the formal logic of propositional calculus should not be applied to science. It is too simplistic, which is why higher-order logical systems were developed" he crowed.
Somebody mumbled "Sounds like bullshit to me... I don't think that cockerel has a clue what it's crowing about"
The cockerel then rejoined: (Aug 16, 2015 at 7:57 PM)
' "If P then Q" must be shown to be false.You might do so in two ways.
Firstly by demonstrating that the mechanism linking cause and effect is not sound (If P not always Q).
Secondly by demonstrating that another cause better explains the observations (If R then Q).
This is how science operates. It is known in formal logic as modus tollens or "denying the consequent" '.
At that point, my neighbour's cat miaowed: "There are a number of geosynchronous satellites in geosynchronous orbit, with an orbital period the same as the Earth's rotation period. These satellites return to the same position in the sky after each sidereal day, and over the course of a day traces out a path in the sky that is typically some form of analemma. The radio emissions from these satellites are what causes the Sun to rise and, if you do the calculations (as I have) you find that the correlation between the time of sunrise and the trajectory of one of these satellites (suitably transformed) the time of sunrise is predicted to within seconds".
A pig who had been listening to all this snorted: "YES! The cat has demonstrated that another cause better explains the observations (If R then Q) (™ Entropic Man). The cat has thereby conclusively proved that it is not the cockerel's crowing that causes the Sun to rise."
But somebody then mumbled: "That's bollocks. The fact that a synchronous satellite's orbit "explains" the observed times of sunrise in no way disproves the cockerel's claim. It's a fallacy that finding a "better" explanation disproves some other theory. As is often stated 'correlation is not causation'. Did you catch that, EM?"
Martin A
While the cockerel and the cat and the pig were arguing as to who was more correct, the mouse interjected: “Does it really matter what causes the Sun to rise, just be glad that it does. While I do prefer a world of darkness, without the Sun, it would probably get cold as well, which none of us would like. And while you argue, the Sun continues to rise and to set, so I would say that there is nothing we can do to affect it, either way. Let us just observe, and enjoy...
“Oh, yes… one more thing… has anyone else noticed that it rises and sets at slightly times and slightly different positions every day?”
Who knew mice watch Colombo?
Radical Rodent
Nullis in Verba
If you have a stats package, and want to check my calculation, the GISTEMP data is available here.
Please let me know the result. I am interested to know how my BOE estimate compares with a full calculation.
Incidentally, I did a quick literature search. Everywhere I looked, those working with the data were quite happy that the best fit to the frequency distribution is gaussian.
HarolW
Perhaps you should ask Roy Spencer. It is, after all, his graph.
Entropic man
Martin A
I used the word "demonstrate" deliberately. A better theory has a better mechanism explaining the observations. It demonstrates causation more effectively than the earlier theory.
Your cat, on the other hand, has not demonstrated causation, just correalation. He has not made the final step to demonstrating that both the satellite behaviou and the Sun's apparent movement are caused by the rotation of the Earth.
"Correalation is not causation"
You oversimplify. Where you find correlation, you find causation, but not necessarily between the two correlates.
A correlates with B. It is possible that A causes B or B causes A. It is also possible that C causes A and B, or that there is a more complex relationship.
This is why correlation is only the first step. It shows that some mechanism is generating causation. You than carry out research to increase your knowledge and understanding of the mechanism.
This is why increased CO2 is the default scientific theory to explain the long term trend of post 1880 warming. There is correlation and a mechanism which successfully explains it.
The sceptic claim that the post 1880 warming is due to natural variation fails on both counts.
There are short term correlations and mechaniams( think of Pinatubo).which explain the short term variation. There is no natural correlation or mechanism to explain the long term trend.
Entropic man
EM -
Look, I'm not happy that Spencer did not supply enough information that one could reproduce his graph. [Or even better, code.]
But I got started on this thread because you wrote, "Spencer's comparison between model outputs and radiosonde/satellite data is comparing surface projections with atmospheric temperatures at an unspecified height above the surface." Such a comparison (without discussion) would be unexpected, but certainly is possible, especially for a blog post. Curious, I looked into it. Got RCP8.5 surface data from KNMI, but the global average didn't match Spencer's curve. Limited it to tropics, still didn't match Spencer's curve. So then I asked you why you made the assertion. To date, all you've put forward is that "research" will tell me that "temperature outputs for CMIP5 are air temperatures, 5' above the land or sea surface." I cited a document which shows that CMIP5 provides atmospheric temperatures at multiple altitudes. That would be the logical source of Spencer's model comparison.
If I were more interested in the graph per se, I'd ask Spencer for a fuller description of how it was generated. But I'm not. I was interested in your claim that Spencer made a comparison of mid-tropo observed temperatures to surface projections without disclosure. You've been unable to provide any factual basis for this statement. At this point, my hypothesis is that there is no evidence for such a claim; that you made that assertion based on a faulty assumption that only surface temperatures are available from CMIP5.
Up to you now. You can agree that your claim that Spencer's model curve is surface temperature projection was ill-founded, or you can back it up by showing how RCP8.5 surface data produces the curve. You made an assertion about the graph; it's up to you to show evidence for it. Not Spencer.
HaroldW
HaroldW
Go to the IPCC website.
Download Chapter 11.
On page 11-120 you will find Figure 11.25a. Compare it with Roy Spencer's graph.
This is the accompanying legend:-
Figure 11.25: Synthesis of near-term projections of global mean surface air temperature (GMST). a) Projections of
annual mean GMST 1986–2050 (anomalies relative to 1986–2005) under all RCPs from CMIP5 models (grey and
coloured lines, one ensemble member per model), with four observational estimates (HadCRUT4:(Morice et al., 2012);
ERA-Interim: (Simmons et al., 2010); GISTEMP: (Hansen et al., 2010); NOAA: (Smith et al., 2008)) for the period
1986–2012 (black lines)
Note " global mean surface air temperature (GMST)".
Entropic man
I used the word "demonstrate" deliberately. A better theory has a better mechanism explaining the observations. It demonstrates causation more effectively than the earlier theory.
EM - I can see now that you were assigning different meanings to a couple of words than what I had assumed. Plus you are now clarifying what you had previously said.
I still think there is a fallacy but not so simple to elucidate as the obvious fallacy that the cat's rubbish proves the cockerel's rubbish false.
You still have not made clear what you mean by "better". Unless defined, it's a vague and subjective term. It's obviously a problem if deciding whether or not a hypothesis has been shown to be false depends on subjective opinions.
Martin A
HaroldW. You are wasting your time. For a start EM does have a point if you're daft enough to believe the model outpost and the satellite temperatures are absolute temperatures, which I presume you don't. Secondly he'll inundate you with references from the scientific literature that he's got from SkS. Also mainly bollocks.
Fact is that Spencer's temperature anomalies are a whisker away from HadCRUT4. And both are anomalies, nothing to do with absolute temperatures.
He, like BBD before him (if they're not the same person) will go away as it becomes evident he'e doing nothing more than parroting SkS.
geronimo
I think it would be worth relating this discussion back to the topic - Does Climate Science Exist?
At a very minimum any subject that seeks to be scientific should seek to be more rigorous, making more clearly defined statements that are also supported by the evidence, and move away from bland statements based on vague theories.
I would propose evidence climatology is degenerating is shown by Entropic Man.
For instance on Aug 15, 2015 at 11:55 PM
The correct comparison between models and observation is with HadCRUT4 like this. Note that HadCRUT4 shows a rise of -0.6C between 1979 and 2012, well within the projected range.
If you look at the graph, the projected range is extremely broad and the actual data line is bumping along the bottom of that range. The vagueness of the models allows both belief in climate catastrophism and maintaining connection with real world data which shows at best a moderate influence AGW. I quote again Richard Feynman on the Scientific Method
You cannot prove a vague theory wrong. If the guess that you make is poorly expressed and the method you have for computing the consequences is a little vague then ….. you see that the theory is good as it can’t be proved wrong. If the process of computing the consequences is indefinite, then with a little skill any experimental result can be made to look like an expected consequence.
Or on Aug 19, 2015 at 12:53 PM
If you have a stats package, and want to check my calculation, the GISTEMP data is available here. ….. Incidentally, I did a quick literature search. Everywhere I looked, those working with the data were quite happy that the best fit to the frequency distribution is Gaussian.
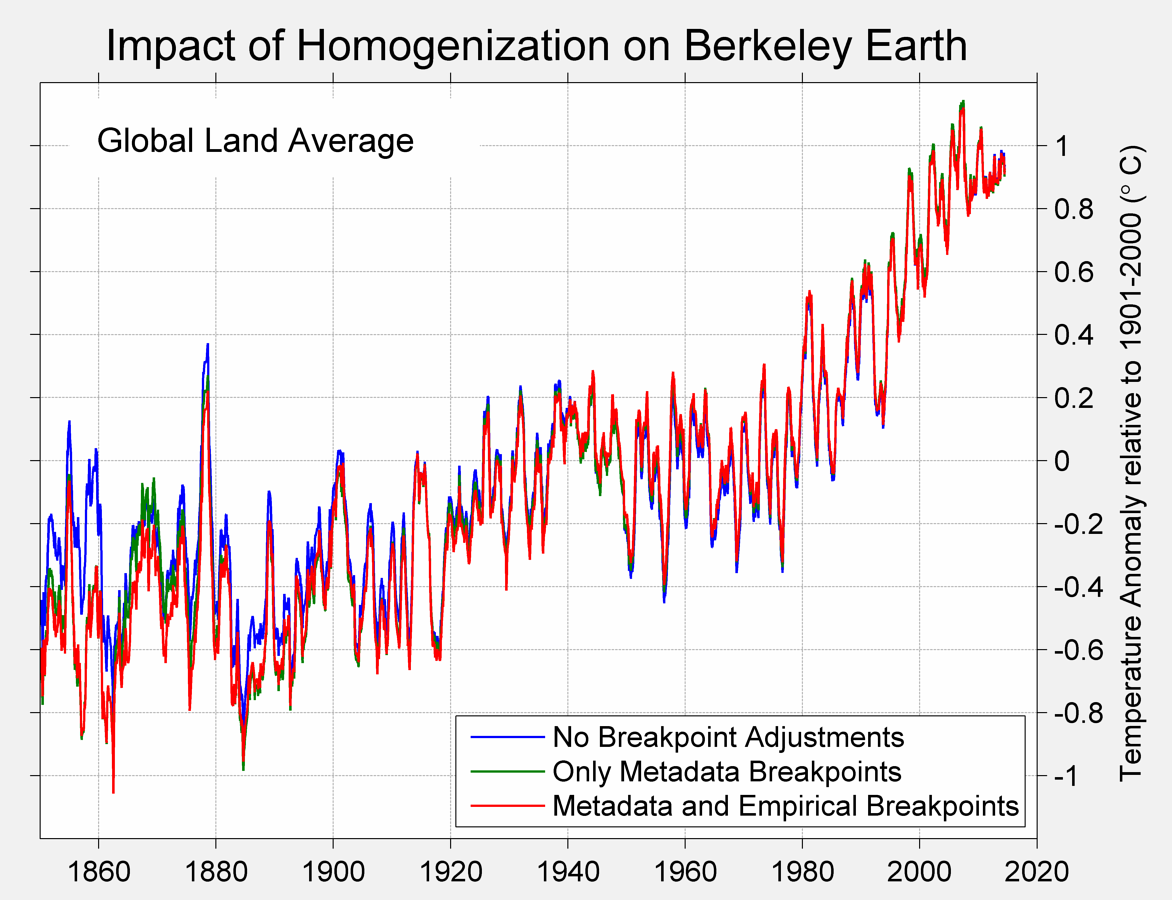
Everyone being quite happy with assumptions made is not science. In the raw temperature data there are various recognized measurement issues (siting, measurement method, UHI etc) that can bias the results. The assumption is that nearby stations are exposed to almost the same climate signal and globally deviations are Gaussian. So homogenisation will eliminate the measurement biases. This will not just improve the data somewhat, but cleanse the data of all measurement biases leaving only pure climatic data. Checking the data I have found that this assumption clearly does not hold in specific cases; that homogenisation has another purpose; and that different densities of temperature data may lead to different degrees to which homogenisation results in smoothing of real geographical differences in climatic trends. Further, it possible to do test whether these real variations in trend cause systematic biases, such as reduce the size of the early twentieth century warming in relation to that of the late twentieth.
Looking at the data I realised that we have very imperfect data about climate - temporally, spatially and qualitatively. In realizing the limits of the data, and checking we have the most accurate possible, we can realize the current limits of our collective knowledge and therefore identify the biggest gaps and anomalies.
Kevin Marshall
Incidentally, I did a quick literature search. Everywhere I looked, those working with the data were quite happy that the best fit to the frequency distribution is gaussian.Aug 19, 2015 at 12:53 PM Entropic man
Says it all.
Big Oil
Entropic man (Aug 19, 2015 at 5:24 PM)
"Go to the IPCC website...On page 11-120 you will find Figure 11.25a. Compare it with Roy Spencer's graph."
If you can tease out the RCP8.5 strands from the Figure 11.25a "spaghetti graph", and make a valid comparison to Spencer's pasta, you have a much sharper eye than I.
I wrote before that I compared Spencer's graph to RCP8.5 surface temperature projections, and found that they didn't match. However, I realize that I didn't post my comparison, which used the multi-model mean rather than individual curves. Downloaded anomalies from KNMI, rebaselined as Spencer directed (least-squares trend from 1979-2012 is 0 at 1979), computed annual averages and then running 5-year means. I repeated for the tropical region (20 south latitude to 20 north). The result is here. It is clear that Spencer's multi-model mean curve "runs hotter" than the surface temperature proections, global or tropical. This is not surprising, as Spencer mentions in his text the "lack of a tropical upper tropospheric hotspot in the observations."
geronimo (10:16) -- Thanks for your concern, but I am not doing this to convince EM, but to determine for myself if Spencer took liberties in that graph. As I wrote in an earlier comment, Spencer already "lost points" with me for not adequately describing the derivation of the model curves. A comparison of T_MT and radiosonde measurements to surface temperature projections would only be acceptable to me if it were clearly disclosed. (And ideally, caveats discussed.) It appears that the temperatures are not surface temperatures, as EM claimed. So, case dismissed.
HaroldW
"If P then Q" must be shown to be false.You might do so in two ways.Firstly by demonstrating that the mechanism linking cause and effect is not sound (If P not always Q).
Secondly by demonstrating that another cause better explains the observations (If R then Q).
This is how science operates. It is known in formal logic as modus tollers or "denying the consequent"
Aug. 16, 2015 at 7:57 PM Entropy man
(EM - I suggest you stop pretending you are an expert in formal logic. We can all read Wikipedia.)
What you are saying is this (please correct me if I have misunderstood):
___________________________________________________________________
If you have a hypothesis that something (A) causes something else (B), then you can show that the hypothesis is false:
- - - "Firstly" by showing that A does not cause B.
- - - "Secondly" by coming up with a "better" hypothesis that something else (ie something other than A) causes B.
___________________________________________________________________
Have I understood correctly? Yes/No? Assuming "yes", I'll carry on.
OK on "Firstly". That obviously will have shown that the hypothesis is false. No dispute about that.
But "Secondly" is just another hypothesis. You might prefer it for various reasons, but its existence has not shown the first hypothesis to be false. It's a fallacy to say it has. (Although it is clearly something you are convinced of.)
This is why correlation is only the first step. It shows that some mechanism is generating causation. You than carry out research to increase your knowledge and understanding of the mechanism.This is why increased CO2 is the default scientific theory to explain the long term trend of post 1880 warming. There is correlation and a mechanism which successfully explains it.
"the default scientific theory"
It is not a theory. It is no more than a hypothesis.
EM, you are always banging on about the difference between those terms. You belittle people who use the term "theory" for something that has not been confirmed, even telling them that 13-year old schoolchildren know the difference.
correlation
The "correlation" amounts to "CO2 has increased" and "average temperature has increased". Any detailed look at the graphs shows that beyond that, correlation is minimal
explanation
The "explanation" is no more than a plausibility argument. BH poster rhoda was frequently asking for actual *evidence* that increased CO2 had caused observed warming but, so far as I know, none was ever offered.
The sceptic claim that the post 1880 warming is due to natural variation fails on both counts.
Please use the correct words. It is, I imagine, somebody's hypothesis that post 1880 warming is due to natural variation, so please call it that rather than using the loaded term "claim". (Have you been swotting up at SkS again? - your choice of words makes it sounds like it)
But note that there are many sceptics of AGW (me included) who think it's an completely open question what has caused climate changes over the past millennium. So the term "the sceptic claim" is inappropriate on that count too.
It's obvious that the reasons for the observed variations are not understood. Witness the bafflement of climate science at "the pause" which was not foreseen and has not been explained. (52+ explanations = no explanation)
I refer you to what BH commenter Nullius in Verba said:
Until someone can exhibit a validated model of natural background climate variation, it is logically impossible to prove the AGW hypothesis. Until someone can exhibit a validated model of climate variation under the influence of CO2, it is logically impossible to disprove it either. We simply don't know. There's no evidence, one way or the other.
Aug 11, 2015 at 10:14 PM Nullius in Verba
You seem (from your recent postings) to disregard what NiV said there. But it's completely fundamental. Whether you like it or not, AGW is just a hypothesis. (And anything else that "explains" observed warming is also just a hypothesis.)
(If you don't like NiV's word "prove" replace it by "confirm" - I know you are always banging on about how "proof" does not exist in science.)
Bottom Line
Coming up with a second hypothesis that explains something "better" in some way than a first hypothesis does not falsify the first hypothesis. It's a fallacy to say it does.
Martin A
Martin A. I've given up already, it reminds me of the time that I was discussing something with a sociologist graduate who told me: "There are no absolute truths." I tried to explain to him that for that to be true required the existence of absolute truths. He thought I was "Trying to be clever."
geronimo
Kevin Marshall
If homogenisation were a problem there would be significant differences between the raw and processed data. That turns out not to be the case.
 Entropic man
"If you have a stats package, and want to check my calculation, the GISTEMP data is available here."
I've got several stats packages and I already know where the GISTEMP data is. What I don't know the location of is a validated statistical model of the natural background variation, and without that, the calculation cannot be done.
"Incidentally, I did a quick literature search. Everywhere I looked, those working with the data were quite happy that the best fit to the frequency distribution is gaussian."
As Mandy Rice-Davies said "Well they would, wouldn't they?"
You might want to review the past discussions regarding Doug Keenan's challenging the Met Office on statistical significance and statistical models. Or the 'unit root' discussions from further back.
The upshot is that the standard textbook methods for addressing time series with unknown models confirm that climate data definitely does not fit trend+iid Gaussian, nor even trend + AR(1), as the IPCC assumed and the Met Office cited. The Box-Jenkins textbook method identifies it as something like ARIMA(3,1,0) - the 1 in the middle indicating a 'unit root', which basically means there's not enough data collected yet to fully explore the variable's behaviour and so identify it. ARIMA(3,1,0) is an approximation only valid for short intervals.
The climate models don't fit the observed distribution either - for example, most of them underestimate the length of "pauses" fatally at the 99% confidence level. And while there have been a few other proposals like Koutsoyiannis with his long-term persistence models, or Lorenz and his fractals, I don't think even the authors and proponents would claim them to be validated.
A lot of climate scientists remained blithely ignorant of all this - they're specialists in atmospheric physics after all, not statistics. But it's a serious problem nevertheless.
Nullius in Verba
Martin A
It is all hypotheses, though among scientists hypotheses which have survived repeated test tend to be called theories.
You asked about better hypotheses.
Consider your own field. The first prevalent hypotheseis explaining electricity was Galvani's, that electricity was generated by animals.
That developed into Volta's hypothesis that electricity was produced chemically. This led him to produce the first batteries.
By the end of the 19th century the prevailing hypothesis was Maxwell's equations. Westinghouse was producing generators and electric motors. Tesla was producing coils. Marconi was sending transatlantic radio signals.
Now the prevailing hypothesis is quantum electrodynamics. You use it to design chips and produce such exotica as transistors, Josephson junctions and tunnel diodes.
If we live that long it will be interesting to see what replaces QED and what new science and technology it suggests.
Each hypothesis improved on its predecessor, allowing more precise prediction regarding the behaviour of electrical systems and suggesting new lines of research. Each hypothesis was an extended and improved version of an earlier hypothesis. None of them has been proven.
Consider Newton's Law of gravity and general relativity.
Newton described the behaviour of objects by an inverse square law hypothesis,
He did not explain why this was so. Nor did he cover anomalies such as the precession of Mercury. The basic hypothesis of General Relativity is that matter tells space how to curve and curved space tells matter how to move. It explains anomalies which the Newtonian hypothesis did not.
Consider geology. In 200 years it went from creationism through competing hypotheses of gradualism and catastrophic to plate tectonics. Each provided a more effective explanation or the Eart's geological behaviour.
You see it in all sciences. Hypotheses are tested, modified to better reflect reality and updated or replaced as more evidence comes in.
Entropic man
Nullis in Verba
"a validated statistical model of the natural background variation, "
Why do you need this to calculate the probability that the two ends of a time series linear regression are different?
It strikes me that you are deliberately making a simple analysis much more complex than it needs to be.
Entropic man
EM: "Make your point clearly without all your usual bullshit."
I'm afraid my "usual bullshit" comes with the package, along with good manners - you should try them. I know it's frustrating when someone's told you you've made a blunder and you can't figure out what it is. At least I think it must be frustrating if you consider yourself above the average and it is a bullshitter who's baffling you, but you know what the answer is so simple that there is no hint that won't reveal it to you, or Dana. I have to remain enigmatic I'm afraid.
I think Cowtan et all (isn't he one of the kidz over at the SkS gang hut too?) 2015 will go the same way as Cowtan and Way 2014, it will ignored by the climate science community, but not challenged. In C&W they simply made up (the scientific term is I believe "interpolation") temperatures in the Arctic. In Cowtan et al 2015 they simply made up values for marine air temperatures where there weren't any by assuming that the MAT was higher than the SST. (h/t Ross McKitrick)
Of course in the higher level logic used in climate science it may be alright to have computer generated data accepted as the real thing, but it doesn't work like that amongst the lower intellects scrabbling around in the world of simple logic expecting the data used to prove a scientific theory to be real data from the real world.
The odd thing about Cowtan et al 2015 is that it purports to show that the world's finest scientists have, for 25 years, been comparing the forecasts with the wrong real world data (if we can call HadCRUT4 real world data after the recent "adjustments"). What it is effectively saying is that the climate modellers and the IPCC are a bunch of tosspots who haven't noticed they're using the wrong data. And yet they''ve stayed silent, embarrassment? or perhaps the paper is seen as helping the "cause" so they're staying schtum and ignoring it as they did with C&W 2014.
Climate science the only science where failure in the real world is the fault of the data.