


 Josh
Josh Countdown to alarm - Josh 317
Posted by Josh
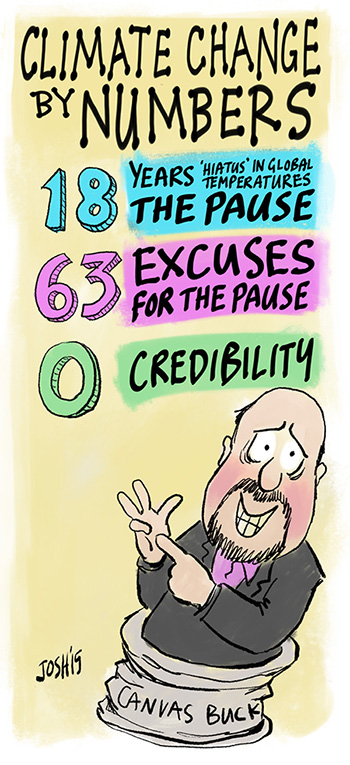
I thought the BBC 4 programme 'Climate change by numbers' started well (and I am a big fan of Hannah Fry). But sadly it descended into the usual climate change innuendo and alarm.
The first number was fine - 0.85˚C is not scary and not catastrophic.
The second number, 95%, was, as ever, vague and hand wavy. So the 50% of the warming since 1950s we've caused amounts to... maybe 0.3˚C? So not that much after all. And the pause continues. And Arrhenius was wrong about the ice ages. And there's lots of uncertainty. How is Chelsea doing?
Worse was that by the third number the programme had left the planet and decided that the 0.3˚C warming had magically turned into 1˚C warming and we simply must do something about it. Or else.
Nice try BBC, great start by Hannah but it needed a medic by the end. At this rate I'm not sure the patient will make it all the way to Paris.
The number 63 comes from here.
Reader Comments (34)
You're getting very good at this, Josh.. :-)
Program is not available to me here in U.S., but I don't feel like I missed much.
(Nice cartoon, Josh)
I was bemused as to how the model of football team performance did not actually match the reality. Even my wife commented on that.
Also the pause didn't seem to get a look In.
Tonyb
It seemed to me to be too eager to set out the case for climate change from an alarmist perspective. There was little scrutiny of the claims they made and absolutely no independent challenges allowed! We can be sure sceptics won't be getting an hour and a bit to put a contrary view, either.
No doubt more of the same beckons via Horizon on Wednesday night.
Summary: predictable propaganda.
Josh is spot on. Zero credibility.
And after you have trashed your credibility, how do you get it back?
Not, I fear, by generously applying Snopaque to history.
The BBC, the MET, CRU and all the rest of them have left no greenie catastrophist stone unturned in promoting their religion and in manufacturing dodgy 'evidence' to justify lunatic energy policies.
Watch the Beeb on Global Warming (yet again)? I'd be as likely to send the grandkids to a party organised by Rolf Harris.
If they want to examine numbers, when will they come clean on the 28 "leading scientists", or the 4 teams of barristers they set on to keep their true identities secret?
Pithy summary by James Delingpole:
"Climate Change By Numbers (BBC4, tonight)
As with its sub-Leni-Riefenstahl Great European Disaster, the BBC appears to be sufficiently embarrassed by its latest alarmist propaganda effort not to have made preview copies available to journalists till the very last minute. I think we can safely predict what it’s going to say though: “Here are three mathematicians. Really clever, boffinny mathematicians who are, like, really amazing at maths and shit – way better than you. And do you know what these clever mathematicians have all worked out independently? CLIMATE CHANGE IS REAL!!!”
If 100 gamblers had bet money on temperature rises based on Hansen's predictions, they would have lost.
Presumably over 97% of climate scientists would have recommended betting somwhere in between Hansen's highest and lowest estimates, on the precautionary principle.
If 1.5% of the remaining climate scientists had bet higher than Hansen, that would leave 1.5% of climate scientists being right.
A statistician would say those were poor odds to gamble against.
Therefore 97% of advice from climate scientists should be ignored, along with 50% of what is left.
@ cheshirered
An hour for sceptics? Hmmmm...weird isn't it. Whenever I ask for evidence for your views on (lack of) global warming all I get is hand waving and made up facts. Even had one of you (I forget who) who said you did not have evidence as it would be like proving a negative!
[Snip]
Not to worry though. If you scaled it by say the 97% rule then we could reduce to say (and I'm being generous) 2 minutes. Even I know you could waffle for that long.....:-D
Onbyaccident, what happened to the medieval warm period in the hockey stick graph, and why?
@Onbyaccident
Yet the warm-mongers fear a public engagement with skeptics as shown again and again over the years. Unsurprising, really, considering the failure of the many predictions the warm-mongers have made.
But please correct me if I'm wrong and list those predictions that have failed together with a reasoned scientific explanation of why those predictions have failed. Godspeed.
Meanwhile...
http://www.theglobeandmail.com/technology/science/the-mysterious-and-cool-science-of-icicles/article23241318/
Wasn't this the show Tamsin was swearing would be different?
Mark
I think the catastrophist media arm is ramping up just had a "hit piece" on the CBC national news, some wildlife photographer lamenting the loss of glaciers and all the normal associated hand waving about CAGW. Not a single substantiating supporting number, big appeal to a feel good campfire crowd. I think the PR guys are starting the ramp up to Paris too early, the public are disengaged and I think they will react with even more deserved disdain. The CAGW agitprop crowd are, as is typical of the arrogant and conceited underestimating the intelligence of the average punter. Think I need to write to the CBC again.
I wrote to the CBC by way of their ombudsmen position with a complaint about their reporting in 2013, point of issue was the anchor person stating that CO2 was the most powerful green house gas. Here below, verbatim, is a direct quote from a response I received from the executive producer for the CBC national news program. Palm meet face.
"With respect to your second point, you wrote that the program host said, “Carbon dioxide is the most
powerful green house gas in the atmosphere”. This is “factually incorrect”, you wrote, since water vapour
is the “predominant green house gas in terms of effect … by an order of magnitude”.
"You are right; water vapour is by far the most abundant heat trapping gas in the atmosphere and
accounts for the largest percentage of the greenhouse effect, up to about 85 per cent when clouds are
included. However, it is rarely mentioned in any discussion of anthropogenic climate change. The reason
is that water vapour only lasts for a few days in the atmosphere before falling back to earth again. CO2,
on the other hand, accumulates, staying in the atmosphere from anywhere from 30 to 100 years. So the
more we create through the combustion of fossil fuels, say, the more there will be in the atmosphere."
I only saw the last bit about predictions and the Monte Carlo method. Putting aside the obvious bias to a warmist view there were some gems: the Monte Carlo method came from a defined and well bounded system. When they used race driving and statistics a canny viewer would have realised (I hope) that it was the amount of good accurate data that helps with the models. This was reinforced when talking about the thread breakage. Careful collection of data and rigourous method is what makes statistics shine.
Now look at climate models and the underlying data. Not really the same is it? Maybe the penny will drop... But I doubt it.
I'm always amazed at the lack of metrology and process knowledge in these shows. As if getting data is secondary to using it.
Nice one Josh. Love the canvas bucket. I noticed on the programme that the temperatures in the two buckets differed by about 0.1degC. I bet those ancient mariners with their mercury thermometers could spot the difference. Who'd have thought it would be so important as to warrant inclusion in such a programme to the exclusion of any discussion of the pause or the chaotic nature of the atmosphere? Clinate change for dummies!
We'll at least they got rid of the pause. All you had to do was infill Arctic temperature data. Who knew? All the 63 pause explanations were all unnecessary. I am going to get a drink from the error bar to celebrate. Anyone for a warm one?
The prog was obviously conceived BEFORE the recent brouhaha over homogenisation erupted. Iceland's hot and cold periods just "homogenised away! Great stuff! Iceland has the only reliable, longterm data in the whole of the Arctic - how inconvenient! And not a dickiebird about the Antarctic.
As stated above, statistical manipulation depends on input data being correct! Garbage in gets worse garbage out.
Sure, there are 10,000 surface measuring stations but only a few hundred are used at any one time and even they are changed from month to month by GHCN!
The first section was the only one that imparted anything useful to those ignorant of the debate but even that was selective. It did however concede there was a "controversy" - how did that slip through editing? What about satellite data and the "pause"?
The chaps contributed sod all except the repetition of unfounded assumptions. I had hoped the 95% would explain the basis of probability theory not simply tell us the boffins are 95% "sure" - what a bloody unscientific concept! Why employ statisticians and mathematicians if not to explain this?
Oh, and it looked as if the tropical "hotspot" was resuscitated, too.
“…If you look at the attached plot you will see that the land also shows the 1940s warming blip (as I’m sure you know). So, if we could reduce the ocean blip by, say 0.15 deg C, then this would be significant for the global mean—but we’d still have to explain the land blip…” —Dr. Tom Wigley, University Corporation for Atmospheric Research, on adjusting global temperature data, Climategate e-mail to Phil Jones, Sep. 28, 2008
I think this is when they reverted to the canvas bucket.
I do not watched it as I have seen the work of Jonathan Renouf which has always been poor and very biased, in the past. Who can forget the laughable "Meltdown" or the repulsive "Climate Wars"?
It is pretty awful (even by BBC standards) for the BBC to allow this unthinking alarmist to produce "documentaries".
Silly me, they are saving the planet so what if there is plebian suffering. I am sure when Jonathan Renouf gets his big fat BBC pension he will enjoy a nice warm house, no matter the amount green energy price inflation..
Who cares about the cold poor people when you are saving the planet? Think of the children!!!
I suggest add a few lines:
- amount spent on "climate change" expressed in currency
- the same amount expressed in a multiple of something useful (number of staffed schools? medical or dental practices?) it could provide.
- benefit accrued to date from "climate change" expenditure.
Good analysis Bish. As I said before the show so the show produced. It's the Brussels Broadcasting Corp after all; They were never going to emphasise anything that could possible put Paris in doubt.
PARIS MUST SUCCEED!
I caught the programme. On the face of it, it probably appeared balanced and open-minded to the casual passer-by. Lots of talk about uncertainty. But, plenty of gaps and selective evidence. Some examples:
- the 0.85 degC rise since 1810 - fine. But the first presenter failed to mention: almost no-one disagrees with that; and failed to menton the 'manmade' bit occurs only since around 1950.
- the 2nd presenter doing the football analogy. He quite unwittingly failed to realise he was showing a perfect example of 'correlation does not equal causation'. He concluded that a team's success most closely correlates with the wage bill. Thus implying that if you pay your players more, your team will be more successful. This is clearly crap. Much more likely, success comes from buying the best players. This results in both more wins and a higher wage bill. And he's a published professor??
- we saw mention of the shrinking Arctic ice. But of course, no mention of the increasing Antarctic ice.
- we heard about the correlation between CO2 and temperature, but no mention that warming precedes CO2 rise.
- We heard about how models confirmed that most of warming of past 60 yrs was due to CO2. But no mention that the ONLY period during which they correlate is just 20 years of that 60 years (late 70s to late 90s).
- and many more.
Overall, the programme provided a clever slight of hand.
Very clever Josh - thanks.
I agree that Hannah Fry's explanation of the 0.85˚C warming since 1880 was OK. But, having (correctly) informed us that the key question was "Why has the Earth warmed?", Norman Fenton sidestepped the issue by taking his cue from the IPCC and concerning himself only with the period since 1951 - and, as oakwood notes, even then focusing only on the 20 or so years when temperature and emissions were in sync. Judith Curry (LINK) has exposed the problem with that approach:
I like this response by Richard Courtney over at WUWT
As for "PARIS MUST SUCCEED!" (Stephen Richards), does the BBC really think that the real obstacles to success (China, India etc.) are remotely likely to be influenced by superficial and misleading programmes such as this?
Did I detect the influence of "Skeptical Science" or similar organisations in this? Can't believe that these 3 statisticians wrote the script or prepared the graphs. There was a subtle attempt at shooting down many sceptic arguments. Have the academics involved been used as propaganda mouthpieces?
You were expecting something other than propaganda?
I couldn't be bothered to do the necessary jumping through hoops to watch the program (sounds as if I didn't miss anything) but I wonder did they try and answer the question I find that has all 'oligists stopped and spluttering. If CO2 is responsible for warming the earth's atmosphere why is mars at minus 60 degree C when its atmosphere is at 95% CO2?
As an aside, if you take measurements in venus' atmosphere where the pressure is the same as the earth's surface it is a nice 20 degree C and venus is much nearer to the sun.
Lord Beaverbrook: further to Judith Curry's observation (see my post at 9:19 AM), here's another comment by Richard Courtney (at WUWT):
Nobody watches BBC4 if they don't have a family member in the program, a special interest or they are too drunk to find the remote. Hardly going to set the world on fire from there.
Digital spy will have the numbers but I am not going to sell them my soul to find out. Anyone signed on with them?
@ Golf C
MWP? It's in there in graphs I see with a decrease in temps from 1000 AD until recent times - although you need to recall that it was likely only a localised (North Atlantic) phenomenon so its effect would be averaged out in global reconstructions of temperatures. Good attempt though but think it more likely to fall into a myth program.
Still struggling to fill that hour methinks.
@ Brute
Predictions? Won't waste my time with sending you model and observation stuff as I don't doubt it would be ignored or misunderstood by yourselves (been here toooo aften before) Not getting all of this are you....bless.
@ Ivan
So you state that Mars = -63C and yet atmosphere comprised of 95% CO2. Try adding the following stats to the picture to see if things begin to get a bit clearer...
Distance from Sun (Mars about 140mm miles; Earth 90mm miles). Apply inverse square law.
Atmospheric pressure (Mars about 7.5mb; Earth > 1000mb).
Penny dropped yet?
@Onbyaccident
The penny dropped years ago - CO2 does not cause global warming.
As for the distance between mars and the sun, if your theory is correct the warming should just be slower.
Good try but no banana.
Time Channel 4 re-ran 'The Great Global Warming Swindle' - with updates as appropriate...
Onbyaccident:
"MWP? It's in there in graphs I see with a decrease in temps from 1000 AD until recent times - although you need to recall that it was likely only a localised (North Atlantic) phenomenon so its effect would be averaged out in global reconstructions of temperatures."
Why is it likely it was only a North Atlantic phenomenon, by what mechanism did this localisation occur and over what time timescale did it persist?
http://faculty.fgcu.edu/twimberley/EnviroPol/EnviroPhilo/WarmPeriod.pdf