


Saturday
Jan312015
by  Josh
Josh
Josh It was the best of times - Josh 312
Josh Temperatures 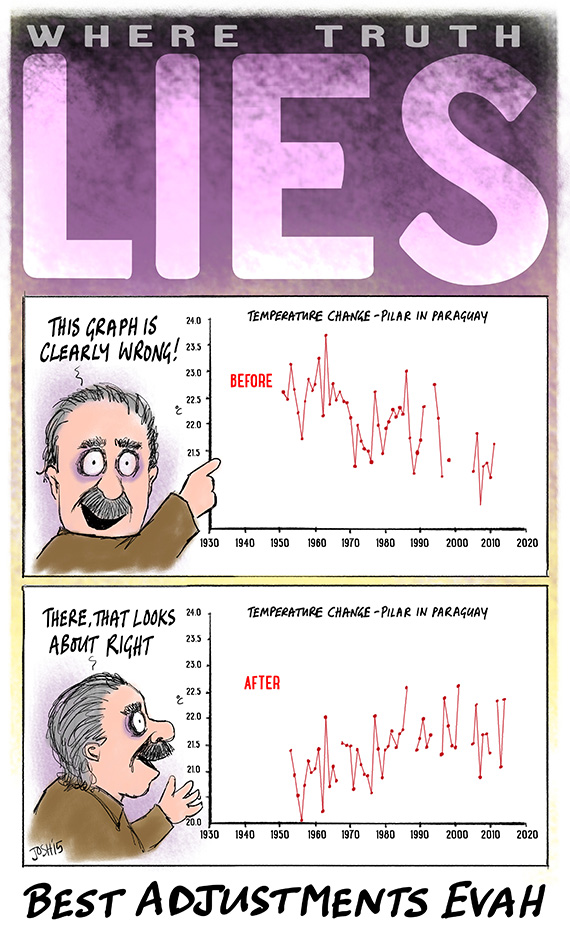
There has been much discussion recently about the adjustments made to past temperatures: see Paul Homewood's excellent posts on Paraguay, Bolivia and around the world; also from Shub; Brandon at WUWT and on his own blog; and a very readable summary by James Delingpole. All very interesting.
Update on Jan 31, 2015 by
Josh
Josh
Jimmy Haigh, SandyS, Stephen Richards and Stewgreen allude to this topic's substantial history and quite rightly so - there are many bloggers and posts that could be mentioned (see the James Delingpole article). Though this particular cartoon was inspired by Paul Homewood's recent post I think there is lot more to come on this story.
Reader Comments (86)
That guy needs to easy on either the mascara or the coffee.........
Let's not forget Steve Goddard at Real Science who really started the ball rolling on this.
purple mascara. LOL.
Jimmy Haigh
Yes, Steve Goddard did start this and gets precious little recognition for it.
Let's not forget Steve Goddard at Real Science who really started the ball rolling on this.
Jan 31, 2015 at 10:30 AM | Unregistered CommenterJimmy Haigh
I'm with Tony/Steven. It was he who started it all and suffered some massive personal attacks from sceptics and the crimatologists. He also may have lost contracts as a result.
So, Thanks a lot Tony.
I'm sure that there is a "good" reason for these "adjustments" and they can be readily explained in a way that makes sense to most people.
Since climate models are designed to replicate overall trends in these official, datasets, I'm sure that Dr. Richard Betts is the perfect choice to explain the rationale underpinning these adjustments.
The hypothesis is right, so the facts MUST be wrong, So adjust the facts to make the hypothesis right.
Garbage. And those doing so should be dismissed. Along with any politician and civil servant, who is informed that the "evidence" of global warming is faked, and continues action to "combat it" on the grounds on incompetency. Of course it won't happen - fancy suggesting politicians and public servants should be competent. Wash your mouth out Graeme!
Yes, Steve Goddard takes the story further:
"2014 was an ordinary year
1998 was a hot year.
The two years weren’t even in the same ballpark."
... It was propaganda generated for politicians.
But it seems he's sitting on the fence a bit
Spectacular Climate Fraud From The White House
"The reason why they expect temperatures to increase as CO2 increases, is because they are tampering with the data in proportion with atmospheric CO2. It is 100% fraudulent self-fulfilling prophesy."
Unfortunately, this systematic fraud by GISS is getting beyond a joke.
GISS now stop you from saving data from your browser so no-one can keep a record of the changes.
I can't say I am too knowledgeable wrt the entire AGW thing, but you should be able, NCC 1701E, to save any web page as a screen-grab (or partial screen-grab) which be be effectively time-stamped on saving. Just a thought.
Determining “Station moves” from coordinates given in metadata is completely meaningless before the GPS era, since most of the coordinates given in GHCN are off by from hundreds of meters to hundreds of kilometers.
I have experience of trying to find coordinates from data in the literature in a completely unrelated (and unpolitical) field, i. e. paleontology and my experience is that no coordinates before GPS can ever be trusted.
Remember that before GPS there were only three ways to derive the coordinates of a site:
1. Send out a geodetic team to triangulate their way from the closest geodetically measured point, usually many kilometers away. Exact but very slow and insanely expensive.
2. Go to the actual place and do an astronomic determination with sextant and chronometer. Not nearly as exact, and also difficult, expensive and weather dependent. After c. 1950 You might be instead able to use radio navigation (DECCA/Loran/Omega), if the site had coverage and you brought a proper receiver and a power source. More exact and largely weather independent but hardly convenient.
3. (Almost invariably used) Get the best available map of the area (probably very small-scale and inexact by modern standards). Take a ruler and measure the distance East-West and North-South from the closest coordinates given on the map. Calculate the result (to do it right you should correct for the curvature of the Earth, never ever done in my experience).
This latter method, if done carefully and correctly (a big if) will at best give results correct at kilometer level, no better.
When you have tried to for a while find sites with “reliable” coordinates from the literature You will understand why the early satellite photo interpreters spent a lot of their time trying to locate old Tsarist-era geodetic markers. These were known to be (fairly) precise, and could then be used to derive the coordinates of modern sites of interest.
Actually “site coordinates” like “about half a mile north of the village on the south slope of a hill with a castle ruin on top” are usually vastly more useful and precise than latitudes and longitudes.
Josh's cartoon title succinctly summarises the situation
@opsimath: archiving is prevented from your web browser: https://stevengoddard.wordpress.com/2012/06/11/giss-blocking-access-to-archived-data-and-hansens-writings/#comment-305096
A screen grab is the fall back position but is much less convenient.
"I can't say I am too knowledgeable wrt the entire AGW thing, but you should be able, NCC 1701E, to save any web page as a screen-grab (or partial screen-grab) which be be effectively time-stamped on saving. Just a thought."
Indeed. But You will only have a bunch of pixels. Not the real data, which will have to be laboriously and inexactly digitized, screen-grab by screen-grab, before you can do any serious analysis. GISS/Gavin knows their stuff. Can't give out data to people who will only try to find faults in them, can they?
The trouble with this situation is that it has been known for years now but nothing actually happens. Steven Goddard, Steve McIntyre, Paul Homewood, Brandon Schollenberger, Ken in Ken's Kingdom, Jennifer Marohasy, Jo Nova, Willis Eschenbach, the Kiwis highlighting flawed NIWA data, and many others have been pointing this out for years.
Before and after graphs of this nature have been shown multiple times, but the "holders" of the data just go on regardless, ignoring this.
Steven Goddard, for example, attempts to demonstrate it more strongly by comparing to newspaper article or other data. For example, the claim that 2014 is the hottest on record is inconsistent with record global sea ice cover (the addition of Arctic and Antarctic sea ice), greatest extent of Great Lakes ice cover, highest snow cover in the northern hemisphere.
We truly live in Orwellian times.
DonKeller
"I'm sure that there is a "good" reason for these "adjustments" and they can be readily explained in a way that makes sense to most people."
I am sure the pretend skeptic (Richard Mueller) and the pretend Nobel Laureates (Michael Mann, Camille Parmesan & Kevin Trenberth) will offer explanations. None of which will be scientific, especially why the previous temperature adjustments are always downwards. However history will eventually expose this pseudo-science for what it is - 97% of climate "scientists" are either incapable or corrupt!
Some of those are corrections for obvious discontinuities, presumably due to station moves.
And if the satellite record is independent of the thermometer record, I don't see how it's relevant anyway.
Though given the involvement of clownatologists I guess one can't rule out some sort of bizarre feedback due to circular cross-calibration between datasets.
If the raw data is available why not create a global data set of raw data.
When NOAA announced their annual temperature, the raw can be announced as well.
The difference would be hard to ignore.
I'm so very very tired of all of these issues being glossed over or willfully ignored by our academic and scientific establishments.
I'm equally tired of the media, activist and political community remaining completely and utterly convinced, and unmovable, on claims that are not only untrue, but diverge from the IPCC itself.
NASA/GODDARD, pushing the boundaries of scientific credibility, to INFINITY AND BEYOND.
They have boldly gone, and recorded historic temperature data, where no scientific evidence has existed before.
You couldn't make this crap up, could you?
NASA/GODDARD are now being employed by the Greek Government, to "adjust" historic debts. Using their considerable expertise, a net deficit should be fabricated into a healthy surplus.
NASA/GODDARD SPACE, where no on can hear you scream scientific integrity.
their excuses for this FRAUD range from the bold lie to the outrageous, as well.
The warmish claim Urban Heat Islands have to be taken into account..lol,,the effect would be the opposite wouldn't it..but do not let a bit of logic stand in the way..
The warmish think the "time-of-capture" change might cause this fraud..lol
if that were the case what is the point of the whole data record, bwahahaha
Graham Lloyd in the Australian has an article on this. Paywalled.
The fraudsters should be in the state pen.
Meanwhile aboard the United States Starship Science Fantasy, slow motion dendro analysis of the Captains Log, should reveal the temperature of his last hot meals
Phillip Bratby, I am not sure the State Pen is big enough. I understand an underpopulated area, the size of Greenland is available. It is called Greenland.
If they get bored, they can always watch ice melt.
Personally I don't really buy into all the upsets about data adjustments. The major ones seem to make sense. Plus Mosher has stated many times that the raw data shows the same trends. I've yet to see anyone prove him wrong.
In any case, I suspect the quality of the raw data is much worse than officially recognised, having visited many surface stations in developing countries. In which case the adjustments are irrelevant, all we can trust is the general pattern of warming, cooling or pausing.
This view is pretty ironic given that Mosher is currently calling me a liar over at Climate Etc. Oh well.
“He who controls the past controls the future. He who controls the present controls the past.”
NASA faking the Moon landings, no longer seems quite so implausible. It's certainly the thought that counts.
Was Lewandowski's highly entertaining paper, actually part of a double bluff, counter conspiracy, blind side honeytrapped, triple ducksquat (with pike) , or am I overestimating Leawandowski's ability to string together more than two applications, for tax payer funded grants, without an exotic overseas holiday?
Either way, I am sure his employers can't believe how easily they took him on, with all the publicity he gets.
NASA/GODDARD and Real Climate Scientists, were going to remake "Thunderbirds", but struggled to find someone to play "Brains". They also struggled with spelling, and settled for "The life of Brians". This upset a lot of people, with faith in Global Warming, and people called Brian.
Like many here I first saw comparison graphs like these on the SteveGoddard site. I and others tried asking about them on Yahoo Answers. The answers were the usual ad homs, non sequiturs and "it's only a sceptical blog" type responses.
Eventually these graphs appeared and there were links to NASA GISS so I thought I would try again. This time my question vanished before anyone else saw it. I managed to re-instate it but it kept vanishing. I did get some responses eventually by posting the link to the question in other answers but only from fellow sceptics.
Here are the links:
http://data.giss.nasa.gov/cgi-bin/gistemp/show_station.cgi?id=501943260004&dt=1&ds=1
http://data.giss.nasa.gov/cgi-bin/gistemp/show_station.cgi?id=501943260000&dt=1&ds=14
People argue that the changes are only small but if you have any number of stations giving a flat response you only need one to have a slope to give the whole set a slope. Remember by how many degrees 2014 was the warmest year ever.
I see a relationship between climate science and justice. It must not only be done but it must be seen to be done.
If the raw data is available why not create a global data set of raw data.
When NOAA announced their annual temperature, the raw can be announced as well.
The difference would be hard to ignore.
Jan 31, 2015 at 1:02 PM | r Chip
Didn't Phil Jones wipe the original data ("because they were short of storage capacity")?
Essay When Data Isn't illustrates UHI, what GISS says it does as a correction, and that what is actually done is the opposite. And that all the other major services (NOAA NCDC, HadCRUT, Meteoschweiz, BOM, NIWA, even BEST) do the same to manufacture warming. And illustrates that the problem has gotten steadily worse, sometimes in shocking ways in the US. A long technical footnote explains at least two underlying logical flaws, regional expectations and Menne stitching. The essay is in ebook Blowing Smoke: essays on energy and climate, foreward by Judith Curry.
I love all of Josh's cartoon. Superb. I would like to see an apology from some well know sceptic(s) bloggers who really attacked Tony Heller.
As I said at the time, it is very important that sceptics don't get into the same mindset as the AGWs. By all means be critical/sceptic of blog articlas but be analytical and fair, please.
Jonathan Abbott
Mosher has been drinking gallons of kool aid. He was co-opted into Muller's army of data manipulators. He also lied about the Japonese Sintex model having a CO² parameter. He has zero credibility in my book.
Philip Bratby, I see that WUWT snipped a comment of yours on this subject. Would you please repeat it here (unless with hindsight you think it immoderate)?
Opsimath (11:29): I have had a bash at your proposal to do screengrabs of GISS's fiddling of the historical temperature record. I conclude that they are depressing the old temperatures, which creates a spurious warming trend:
http://endisnighnot.blogspot.co.uk/2013/08/the-past-is-getting-colder.html
This is what Steven Goddard found w.r.t. the USHCN temperature adjustments :
https://stevengoddard.files.wordpress.com/2014/10/screenhunter_3233-oct-01-22-59.gif
Co-incidence?
Chip 1:03 and Martin A "Why not create a set out of raw data"
Rest assured that they can create hockey sticks of all different shapes and sizes, to fit the exacting requirements of climate scientists financial needs. They have even won awards, and loadsa money, for their previous creations.
For sale: Hockey Stick, little used, never replicated, copied thousands of times. A bit battlescarred, and may contain splices. As yet, allegedly, unbeaten in any court. Genuine reason for sale, current owner embarrassed by awards he didn't actually win.
Brent: It was in line with my above comment about pen state.
Muller has form in the data "presentation" area ...
https://thepointman.wordpress.com/2012/06/22/mullering-the-data/
Pointman
Starting in February 2010 (http://bittooth.blogspot.com/2010/02/being-climate-scientist-for-day.html) I went through each state of the Union and compared data for each one from the TOBS values and the GISS, among other things including the size of the local population around the station. As I went around the states I refined the analysis a bit (see for e.g. Georgia (http://bittooth.blogspot.com/2011/07/georgia-combined-temperatures.html). The GISS data is clearly being manipulated, particularly since with the log-normal relationship between population and temperature that the data revealed, the move to use city data for the GISS values exacerbated the trend they seek. The individual state analyses are given (there is a list on the bottom right of the web site at Bit Tooth Energy. (http://bittooth.blogspot.com).
If anyone wants the data, it is available as a set of Excel spreadsheets, just put a comment on the latest post there (though this will mean you have to learn a little about water jetting - grin).
Can I claim the record for the oldest instrumental temperature change?
It is from the very first year of CET which in the 2007 version is listed as 8.83c for the year. In this years version it has been upgraded to 8.87C
Many others in the historic record have been made higher and lower
Come on Richard. Its Saturday night. You're bound to be peeking at this blog.
What is the reason for amending a 350 year old record?
tonyb
You would have thought that Paraguay's agricultural economy would have allowed them to grow their own temperature record, without UN IPCC intervention or assistance.
In those long forgotten years, that didn't actually exist, even before the ascent of IPCC Mann, Paraguayan children frollicked through the snow drifts, pausing only to eat iced sloths, and watch local tribesmen settle their differences, over a quiet, but very jolly, game of hockey sticks, on the frozen river.
Later, they would go home, watch TV, and realise it had all been a dream, using false memory implants, dreamt up by a Real Climate approved, trick cyclist. It had never been cold at all.
@Jonathan Abbott,
Plus Mosher has stated many times that the raw data shows the same trends. I've yet to see anyone prove him wrong.
Maybe that is because he hasn't released the raw data to public scrutiny. If that was done it would most probably be a much different story.
What is the reason for amending a 350 year old record?
tonyb
Jan 31, 2015 at 5:45 PM | Unregistered Commentertonyb
Because the people reading the thermometers at that time didn't know the need to exaggerate whatb they were reading. They also didn't get out of bed earlier enough and went to bed too early. Proof of this comes from the fact that the readings did not allow for AGW 320yrs hence as we are doing now. SIMPLES.
Feeling too hot and want to cool down? Air con too expensive?
Simple! Borrow a climate scientists time machine, go back 30 years, and lose a few degrees! The further back you go, the colder it gets! You even get to help Real Climate approved scientists recalibrate their thermometers!
Don't miss our special offer in next months Geophysical Research Fantasies, 0.5 for 10, YES! It's an incredible 0.5 degrees down, for every 10 years backwards in science. Take part in making science history, something to tell your grandchildren about as you wait for your sunday turnip to roast.
"Let's not forget Steve Goddard at Real Science who really started the ball rolling on this."
The Talkshop has been at it a while too
https://tallbloke.wordpress.com/2012/10/11/roger-andrews-chunder-down-under-how-ghcn-v3-2-manufactures-warming-in-the-outback/
Ivan,
Mosher is continuously saying that all the BEST data and code is available to download. Again, I've yet to see anyone prove him wrong, although I understand there may be problems with version control.