


 Bishop Hill
 Climate sensitivity in AR5
Climate: sensitivity The assessment of equilibrium (or effective - let's not involve ourselves with the difference here) climate sensitivity depends not only on the empirical and semi-empirical studies that have been discussed at this blog in recent days, but also on the climate models. As the second order draft of AR5 shows, most of the models sit within the IPCC's preferred 2-4.5°C range (represented by the shaded area). There are some models that run hotter, but I don't think anyone takes these seriously.
;) Source: AR5 SOD Box 12.2 Fig 1
Source: AR5 SOD Box 12.2 Fig 1
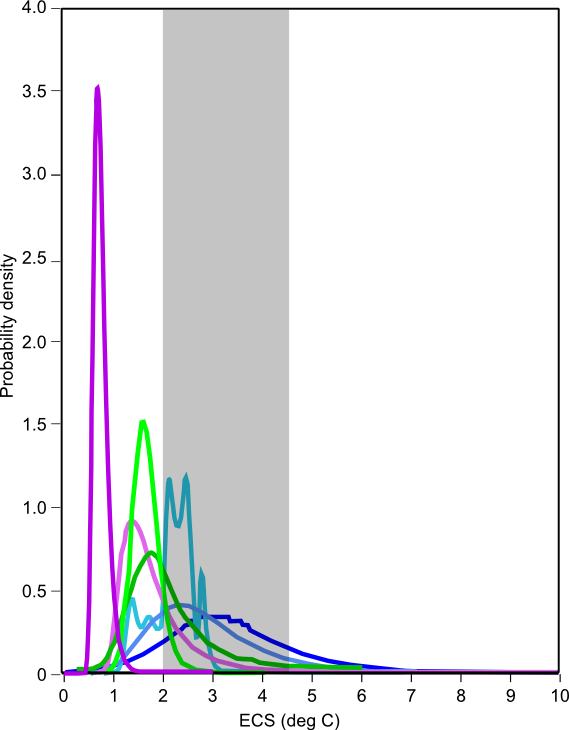
When it comes to the empirically constrained evidence for ECS, in the draft second order draft of AR5, the IPCC shows separate subfigures for each of the different types of study, which makes comparisons somewhat tricky. I've therefore redrawn the PDF graphs (but only the PDFs - it's also hard to make direct comparisons to studies in which only a range is stated) on the same set of axes, colour coding them by type. I've added some recent results as well.
;) Purples are estimates based on satellite data (including Forster and Gregory), greens on intrumental data (including the recent Lewis and Masters papers), and blues on paleoclimate data. The grey band is, once again, the 2-4.5°C range of the IPCC. As noted, the latter relies mainly on GCM estimates. The black curve is the Skeie et al paper, which kicked off all the recent interest in ECS and which has not yet passed peer review. The very tall peak is Lindzen and Choi. Those authors did not include a PDF in their paper, but Nic Lewis provided me with an estimate based on their data. Because the result is so tightly constrained, the exact shape is relatively unimportant.
Purples are estimates based on satellite data (including Forster and Gregory), greens on intrumental data (including the recent Lewis and Masters papers), and blues on paleoclimate data. The grey band is, once again, the 2-4.5°C range of the IPCC. As noted, the latter relies mainly on GCM estimates. The black curve is the Skeie et al paper, which kicked off all the recent interest in ECS and which has not yet passed peer review. The very tall peak is Lindzen and Choi. Those authors did not include a PDF in their paper, but Nic Lewis provided me with an estimate based on their data. Because the result is so tightly constrained, the exact shape is relatively unimportant.
We know that some of the papers that the IPCC is citing should not be included because they have an unnecessary warm bias due to their use of uniform priors in climate sensitivity. Who can forget Steve Jewson's words?
Uniform priors are a fundamentally unjustifiable methodology that gives invalid quantitative results. If these papers are cited in the IPCC, the risk is that critics will (quite rightly) heap criticism on the IPCC for relying on such stuff, and the credibility of IPCC and climate science will suffer as a result.
Among the paleo estimates, Libardoni and Forest and Olson et al are affected by the use of uniform priors in climate sensitivity, and because the data so ill-constrains their results the effects will be significant. On the other hand, the Skeie and Aldrin results are much better constrained by the data and so the effect of the bias should be relatively insignificant. It's also worth noting that correcting the priors in the latter two papers would only make their estimates of ECS lower still. On this basis, here is the spaghetti graph with heavily biased papers paleo papers removed.
;)
Purists may prefer to see what it looks like with all the flat-prior papers removed and the relevant graph can be seen here.
There is clearly a discrepancy between the paleo and other estimates, with the paleo estimates spanning much wider ranges - these studies are very badly constrained indeed. It seems to me that the best way to deal with this is to recognise that the range of overlap is the area that can explains both sets of results and that this should be treated as the best estimate of ECS. On that basis it's hard to justify a range that spans much more than 1-3°C.
If there are other PDFs that people think can be included, by all means send them over and I can add them in. In the meantime WUWT has a compilation of low-sensitivity studies, which includes all the studies that only publish a range rather than a PDF.
Reader Comments (23)
The AGW Creed
appointed to be read at all environmental conferences
I believe in Global Warming,
which will destroy heaven and earth unless we change our ways.
I believe in Al Gore,
Who conceived the Internet
and the hockey-stick graph, born of Professor Mann.
It suffered under McIntyre and McKitrick,
was crucified, disproven, and was buried.
It was cast on the reject pile.
On the third day It rose again.
It was published in the Proceedings of the National Academy of Science,
and is displayed in a prominent position in all IPCC literature.
It will apply again as soon as global temperatures start rising.
I believe in the CO2 tipping point,
the IPCC Assessment Reports,
a CO2 sensitivity figure of over 4 deg C,
the accuracy of GCMS,
an anthropic cause for all climate variation after 1970,
and grants everlasting.
AMEN.
DG,
Great work!
"and grants everlasting"
Classic!
It seems to me that the best way to deal with this is to recognise that the range of overlap is the area that can explains both sets of results and that this should be treated as the best estimate of ECS.... probably needs a slight correction
Who believes this "empirical" rubbish anyway?
It doesn't agree with the models, so it can't be right.
These climate sensitivities are almost useless. It has the same validity of getting stomach cramps after eating shellfish. Whatever tests you do, the shell fish are going to get the blame - unless or until there is absolutely concrete evidence something else is the cause.
Likewise, we are always going to see positive climate sensitivities tending toward the IPCC estimate until natural variation brings the temperature down ... or we have a long period without warming.
That is why you have to do this the proper way. One has to start by forming a model of typical climate variability. Any electronics engineer understands the concept of a "Noise source" ... a voltage, current or other source of noise. It has a specified frequency distribution and scale of the noise.
Now try and find anything equivalent for climate!
There are none. Which shows that they simply haven't a clue of even very simple noise modelling. So they are totally absolutely clueless whether the present rise in temperature is consistent with the "normal" level of climate variability or whether it is higher than one would expect.
That is the real test of whether there is a problem with the climate - is what see consistent with "normal" or is not.
In contrast, these climate models are trying to model something without any idea whether what they are modelling could all be chaotic noise (and so unmodellable except as a noise perturbation) or whether any of it is "signal" which can be modelled.
To use an analogy... it is a bit like trying to predict how much "male" drink to get in for a stag night party. From previous parties they have calculated that on average each person drinks 2beers .... but they don't know any basic details such as how many of the party goers were men and how many were female.
So, they really do not know whether every other party is a hen-night with all women of whom some drink beer, or whether all the parties were stag nights. Or perhaps it was a few men that all drank 10 beers.
So, depending on your assumption about the composition of the party (men/women) you get a very different multiplier. Likewise, with natural variation ... depending on your interpretation of how much change is "signal" (CO2 driven) and how much is noise (natural variation), you will get very very different results of the likely amplification.
But the first step is to get the basic statics.
estimates or guesstiamtes , the real question is what are the facts on the ground ?
But one important thing to remember is that no AGW no IPCC and UN organisation's , has they are , never every work against their own 'mission ' no matter what the reality.
I've seen climate sensitivities stated with or without the effect of feed-backs. Am I right in thinking that all the figures quoted above are just for the effect of CO₂ and that if feed-backs are negative the final figure would be lower?
[No - these include feedbacks]
The ongoing CO2 climate sensitivity debate is a festering parade of incompetence. Outside of 1975-2000, the up-and-down global temperature record does not correlate with the level of CO2 in the air (but it does correlate, quite well, with the multidecadal ocean oscillations, on top of a presumed half-degree-per-century of warming since the Little Ice Age--so why bother with CO2 at all, why treat the CO2 "greenhouse" theory as sound and settled, is the proper scientific question). When one looks for the simplest, most definitive evidence to force the "consensus" to admit the obvious--that CO2 is not to blame, and their models which assume it is are simply bad science enshrined as "settled"--one need go no further than a proper Venus/Earth temperatures comparison (at points of equal pressure in the two atmospheres, and over the range of Earth tropospheric pressures). Then one finds a definitive rethinking of basic atmospheric warming theory is forced by those two real, detailed atmospheres--a rethinking that denies any global-warming "greenhouse effect" at all, and any non-zero CO2 climate sensitivity whatsoever:
CO2 Climate Sensitivity Vs. Reality
...and one is embarrassed by the continued childish fussing and fighting that masquerades as "expert" estimates, of that which simply does not exist, according that most simple, competent comparison of the Temperature-vs-Pressure curves of Venus and Earth. One realizes climate science is a farce, and a fraud, and above all a mass delusion, and one wonders how to disabuse the world of that delusion before it is too late--when even the "lukewarmers" insist the "basic science" is settled. (The basic science is a total lie, gentlemen and ladies. You are pursuing a phantom, created by the most incompetent scientists ever, and are rendered incompetent yourselves thereby. You are made idiots by your continued serious consideration of patently false science. You are mumbling incoherently in a madhouse, and you need to slap yourselves out of it, and refuse to dignify idiot "experts"--alarmists and lukewarmers alike--any further....unless you or they can explain, within the "consensus" theory, why the Venus/Earth temperature ratio should be precisely (!) due only to the relative distances of the two planets from the Sun, and nothing else. Hint: You cannot, and they cannot. Their science is doomed.)
This is the puzzle for some currently prominent mathematical modellers.
It is claimed amongst our peers, and quite plausibly too, that there exists a functional relationship between two measurable quantities C and T. It is admitted that either of them could, just possibly, also be influenced in unknown ways by unidentified but obviously unimportant phenomena. The task is to determine f, perhaps in tabular form, such that T=f(C) unambiguously.
It is known that over a very long period, the average T was observed to increase approximately linearly with time without any recognised substantial change in C. This has been declared to be a perfectly natural result of the said negligible influences.
There followed a somewhat shorter period when C and T appeared to vary tangibly but independently, with little or no sign of any unique connection between them.
During a subsequent third stage it was realised that C was continuing to increase very regularly and very nearly linearly while T obstinately wobbled about a constant value.
The absolute value of C is small and all changes involved, both in T and C, are also very small. Clearly much ingenuity is called for in the investigation.
Task: (1) Methodology: How do you work out the sought functional relationship? (2) Application: What actually is your best empirical estimate of f()? [Please use GCMs as little as possible because everyone knows that they can easily be coaxed into yielding any desired result.]
Hint: Do not be tempted to retort “There is no such function”. It will not be approved.
Until they can EXACTLY show how much of the temperature change is down to CO2 and how much is down to other affects they will never, ever, be able to ACCURATELY establish what the so called "Climate Sensitivity" is.
Even the name is a misnomer, it is like calling CO2 Carbon, they just do not have a clue of how to do real Science, they are guessing and "programming" in their answers.
It really is a sad day for "Science".
Although I mostly agree with these conclusions, Lindzen and Choi is an outlier: it mainly reflects feedback of TOA radiative flux to temperature fluctuations on relatively short time scales. On longer time scales (a year or longer), feedback is weaker; from CERES data, I estimated a few years ago an ECS of around 2deg. But with considerable uncertainty. So both the location and the spread of the pdf for Lindzen and Choi above are in my view unrealistic.
Is there a place to get these pdf data?
Thanks
Never let data get in the way of a good model...
This, more than anything, demonstrates the models are wrong. So much for all the "the models are based on known physics". The models run too hot because...the physics is wrong. The models are tamed to match reality ("hindcasts") by invoking an additional, unknown, unmeasured quantity ("aerosols") with no proven physical understanding in order to compensate the models for the incorrect physics. Is it farce or Greek tragedy?
"With four parameters I can fit an elephant, and with five I can make him wiggle his trunk" - attributed to von Neumann by Enrico Fermi, as quoted by Freeman Dyson.
Well, this is pretty much like guessing the true length of a unicorn's horn. Whatever method you choose is equally relevant, because there ain't no such thing. Just as there ain't no such thing as a climate sensitivity consistent over a centennial scale.
Surely it is evident that it's irrelevant to compare paleo, measurements and models in pursuit of this particular unicorn. One by measuring hoofprints, one by traveller's tales and one from artist's impressions.
Yes, I'm back from sub-tropical climes and asking again for a justification of even the concept of climate sensitivity. Haven't heard one yet.
Global warming just got a lot worse than we thought - up by 20%. Enough missing heat to keep everyone going :)
The story shows how empirical work and computer models clashed for about twenty years and the situation has been resolved by better experimental work.
Its a unicorn's horn and the less you know about its length, the better.
Thanks for the iron core story, Richard. :)
Why would the IPCC even consider an estimated climate sensitivity figure from any model unless the figure was based on an empirical study in the first place?
I'm with rhoda on that. Unverified models dreamed up on the basis of partial understanding of a complicated physical problem with all sorts of approximations and uncomfirmed assumptions are not physical reality.
[No disrespect to Nic Lewis on that. I think he did a valuable service by showing that cclimate scientists' calculations can be redone in a more careful way to get quite different results from the original results.]
Apr 26, 2013 at 9:13 AM | Dodgy Geezer
Amazing. Funny as can be. Any Anglican would recognize it.
Dodgy Geezer; brilliant! Brought back my 30-odd years as an Anglican chorister, boy and man, now decades in the past.
Your graph and the information following are excellent! May I make use of it (in combination with WUWT information, and an article by Chip Knappenberger)? I am creating a series of articles to carpet-bomb the True Believers where I post, and Climate Sensitivity is a big one *g*
AC Osborne,
A truck went past me (Costa? Cafe Nerd?) that proclaimed they were reducing Carbon.
Thank God. I always thought it was a flabby atom.