


Discussion > GHG Theory step by step
Christmas Panto season
"..... so that the context of the recent warming is clear."
Nov 25, 2017 at 4:48 PM | Phil Clarke
Oh no it isn't!
Try here instead.
https://climateaudit.org/2011/03/29/keiths-science-trick-mikes-nature-trick-and-phils-combo/
 golf charlie
In other words, none of McIntyre's criticisms amount to a hill of beans. MBH89/99 were the first multiproxy studies of their type. We now have many more studies, many more proxies and better coverage, every subsequent reconstruction fits within the uncertainty bands of the 'hockey stick' papers. Certainly the most comprehensive,PAGES 2K has a remarkably similar curve.
Nov 25, 2017 at 2:13 PM | Phil Clarke
Are you aware that Gergis was used in PAGES2K, even though the paper was withdrawn?
https://climateaudit.org/2014/11/22/data-torture-in-gergis2k/
Data Torture in Gergis2K
"Reflecting on then current scandals in psychology arising from non-replicable research, E. Wagenmakers, a prominent social psychologist, blamed many of the problems on “data torture”. Wagenmakers attributed many data torture problems on ex post selection of methods. In today’s post, I’ll show an extraordinary example of data torture in the PAGES2K Australasian reconstruction."
golf charlie
Are you aware that Gergis was used in PAGES2K, even though the paper was withdrawn?
Not a reality based statement. Here's a tip for you - it is a rarity for a McIntyre blog post to be the truth, the whole truth and nothing but the truth.
Phil Clarke
it is a rarity for a McIntyre blog post to be the truth, the whole truth and nothing but the truth.
Nov 26, 2017 at 10:11 AM | Phil Clarke
Are you able to be more specific?
Which bits of Gergis were truthful, and was it honest of PAGES2K to include them despite the original paper being withdrawn?
golf charlie
Sure - the proxy network in PAGES 2K known as AUS2K, is not the one in Gergis et al (2012). Gergis 2012 was withdrawn because the methods section inaccurately claimed the proxy screening was done using detrended data. AUS2K did not have that flaw.
The Gergis team reworked the study to correct the flaw and released it as Gergis (2016). The curve was virtually identical to Gergis 2012, that is, using detrended data was a distinction that made no difference.
Phil Clarke
The Gergis team reworked the study to correct the flaw and released it as Gergis (2016). The curve was virtually identical to Gergis 2012, that is, using detrended data was a distinction that made no difference.
Nov 26, 2017 at 11:48 AM | Phil Clarke
Do you have a source for that?
golf charlie
Here's another example: McIntyre accused Gergis of fudging her selection criteria to exclude the Law Dome data series, as it had high MWP values. Turned out McIntyre had used a different dataset to Gergis, (HADCRUT3 vs HADCRUT3v.) After the error was pointed out the brave Auditor, in a comment buried deep below the post made the breathtaking claim that his point is 'completely unaffected' by a reduction in the t-statistic from 4.71 to 3.65 .
I wouldn't trust him to 'audit' my Nectar Points statement.
For a simple explanation of this issue, Steve McIntyre said Gergis et al used an arbitrary standard which excluded only a single proxy, a proxy which had a strong correlation to temperatures for its area and an inconvenient signal for the authors of the paper (high MWP values). This post shows when you use the correct data, that doesn't appear to be the case. And as HaroldW pointed out, using a different (but similarly named) data set gives results like those McIntyre posted. The implication is McIntyre made rather serious claims based upon him mistakenly using the wrong data set.By the way, when I accounted for autocorrelation, the Law Dome proxy ceases to pass the correlation tests. It's possible I did the calculations incorrectly, but if my results are right , this proxy wouldn't have been used regardless of the requirement there be 50 years of data in the screening period.
http://www.hi-izuru.org/wp_blog/2016/09/failure-to-replicate/#more-2460
Phil Clarke
Do you have a source for that?
You can see both curves plotted here
Finally, today, we publish our study again with virtually the same conclusion: the recent temperatures experienced over the past three decades in Australia, New Zealand and surrounding oceans are warmer than any other 30-year period over the past 1,000 years.Our updated analysis also gives extra confidence in our results. For example, as the graph below shows, there were some 30-year periods in our palaeoclimate reconstructions during the 12th century that may have been fractionally (0.03–0.04℃) warmer than the 1961–1990 average. But these results are more uncertain as they are based on sparse network of only two records – and in any event, they are still about 0.3℃ cooler than the most recent 1985–2014 average recorded by our most accurate instrumental climate network available for the region.
Phil Clarke
Phil Clarke, did you read the full post at Iszuru? Here are some bits you may like, and some you may not like, from Brandon Shollenberger's subsequent comments.
Brandon Shollenberger September 10, 2016 at 4:52 pm
"Alright, so I ran Steve McIntyre's code and gotten the same results as those posted in his comment above. His results match what I obtain when using code I wrote on the HadCRUT3 data set (as opposed to the, correct, HadCRUT3v data set I had been examining). I'm confident the code is accurate. Given that, I reran the code with the HadCRUT3v data set the authors said they used instead of the HadCRUT3 data set McIntyre used."
"This is a point I raised in my early e-mails to McIntyre on this issue. I initially used the HadCRUT4 data set, and I got notably different results than he did. I suggested that cast doubt on the validity of the approach. Correlating against grid cells seems fraught with problems to me, and I don't it is a viable approach. I think to do the work well oen would either need to directly use station records themselves or create temperature fields specifically tailored for the area of interest.
●But honestly, the paper is trash.
●Issues like that are real and I think fundamental to millennial paleoclimate reconstructions. There are just bigger concerns with this paper.
●At a minimum though, I would say repeating one's correlation screening against something like GISS's record should be required.
●That would give at least some perspective on how meaningful any correlations one finds might be.
●Had McIntyre used the correct data set, HadCRUT3v instead of the incorrect data set, HadCRUT3, I am confident he never would have written that. Hopefully it will not be long before he recognizes his mistake and corrects it.
●Incidentally, this further emphasizes that authors should archive the data used in their study and provide sufficient detail to replicate their results. Not knowing what version of HadCRUT3v the authors used or how they handled missing data is a silly obstacle for people who claim to be doing science."
golf charlie
Phil Clarke, are you happy with Brandon Schollenberger's description of Gergis 2016 as "But honestly, the paper is trash" and that the 2012 version was used in PAGES2K to support Mann's Hockey Stick?
Surely both papers were Peer Reviewed by Climate Scientists and approved?
If "trash" supports PAGES2K, which supports the Hockey Stick, where should the Hockey Stick be filed?
golf charlie
Phil Clarke, how did expert Climate Science Peer Reviewers check Gergis 2012 or 2016 if they did not manage to replicate the results? Or did they simply take Gergis' word for it?
●Incidentally, this further emphasizes that authors should archive the data used in their study and provide sufficient detail to replicate their results. Not knowing what version of HadCRUT3v the authors used or how they handled missing data is a silly obstacle for people who claim to be doing science."
golf charlie
Phil Clarke, some of the criticisms of the criticism of Bates, about Karl 2015 are commented on further here:
(Peterson, of Peterson Connolley and Fleck, is also mentioned)
https://judithcurry.com/2017/02/06/response-to-critiques-climate-scientists-versus-climate-data/
The following is an interesting comment
rpielke | February 6, 2017 at 11:28 am |
"I want to put this erroneous claim to rest.
“other (sort of) independent analyses of surface temperatures”
here is what is in the CCSP 1.1 report"
"......"
“The global surface air temperature data sets used in this report are to a large extent based on data readily exchanged internationally, e.g., through CLIMAT reports and the WMO publication Monthly Climatic Data for the World. Commercial and other considerations prevent a fuller exchange, though the United States may be better represented than many other areas. In this report, we present three global surface climate records, created from available data by NASA Goddard Institute for Space Studies [GISS], NOAA National Climatic Data Center [NCDC], and the cooperative project of the U.K. Hadley Centre and the Climate Research Unit [CRU]of the University of East Anglia (HadCRUT2v).”
"These three analyses are led by Tom Karl (NCDC), Jim Hansen (GISS) and Phil Jones (CRU)."
There is also a link to another issue
https://cliscep.com/2017/02/06/instability-of-ghcn-adjustment-algorithm/
golf charlie
Are sea shells a better climate indicator than lonesome pines?
https://wattsupwiththat.com/2017/11/27/significant-finding-study-shows-why-europes-climate-varied-over-the-past-3000-years/
"Ocean floor mud reveals secrets of past European climate
Samples of sediment taken from the ocean floor of the North Atlantic Ocean have given researchers an unprecedented insight into the reasons why Europe’s climate has changed over the past 3000 years." nb, the article mentions "why" change occurs.....
Presumably Climate Scientists will argue that the floor of the North Atlantic Ocean has its own microclimate, and world temperatures can not be calibrated from local conditions, as Mann did with his Hockey Stick.
golf charlie
A post at NTZ that shows how climate scientists made disappear most of the warming and subsequent cooling that took place around 1940-1970. We were comparing that particular warming with the recent warming just a few days ago.
Although climate scientists removed most of the evidence in the temperature record, they could not do anything about the 300+ papers on the subject.
Why are climate scientists such cheating, lying, corruptors of their own profession?
Schrodinger's Cat
Schrodinger's Cat, this post?
http://notrickszone.com/2017/11/27/before-1960s-70s-global-cooling-was-erased-it-caused-droughts-crop-failures-glacier-advance-ice-age-threats/#sthash.YWyopTGI.dpbs
Until the mid-1980s, it was widely accepted in the peer-reviewed scientific literature that there was an abrupt global cooling trend between the 1940s and 1970s.
The amplitude of the climate change amounted to more than -0.5°C of cooling in the Northern Hemisphere, as documented by NASA (1981).
Hansen et al., 1981 (NASA) “[T]he temperature in the Northern Hemisphere decreased by about 0.5°C between 1940 and 1970, a time of rapid CO2 buildup. … Northern latitudes warmed – 0.8°C between the 1880’s and 1940, then cooled – 0.5°C between 1940 and 1970
Obviously this was unacceptable evidence for the Hockey Teamsters, so Peterson, Connolley and Fleck 2008 decided to "adjust climate science history", and Joe Romm cheered them on:
http://grist.org/article/mythbusters/
Killing the myth of the 1970s global cooling scientific consensus
By Joseph Romm on Nov 15, 2008
"There was no scientific consensus in the 1970s that the Earth was headed into an imminent ice age. Indeed, the possibility of anthropogenic warming dominated the peer-reviewed literature even then."
"So begins an excellent review article [PDF] in the Bulletin of the American Meteorological Society by Thomas Peterson, William Connolley, and John Fleck."
"The BAMS piece is easily the most thorough explanation and debunking of the issue I’ve seen in a scientific publication. Any progressive who is engaged in the climate change arena must be able to quickly and assuredly respond to this myth because it continues to live on, thanks to the deniers’ and delayers’ clever strategy of ignoring the facts."
In the NTZ post is a listing of those concerned about Global Cooling, and in at 87 is none other than John Holdren, formerly President Obama's Science Expert, teamed up with Malthusian doom merchant, Paul Ehrlich
87. Holdren and Ehrlich, 1971 Global Ecology: Readings toward a rational strategy for man [pgs. 76,77] … “It seems, however, that a competing effect has dominated the situation since 1940. This is the reduced transparency of the atmosphere to incoming light as a result of urban air pollution (smoke, aerosols), agricultural air pollution (dust), and volcanic ash. This screening phenomenon is said to be responsible for the present world cooling trend—a total of about .2°C in the world mean surface temperature over the past quarter century. This number seems small until it is realized that a decrease of only 4°C would probably be sufficient to start another ice age. The effects of a new ice age on agriculture and the supportability of large human populations scarcely need elaboration here. Even more dramatic results are possible, however; for instance, a sudden outward slumping in the Antarctic ice cap, induced by added weight, could generate a tidal wave of proportions unprecedented in recorded history
Climate Scientists want to blame Trump for not trusting them?
golf charlie
Another look at the hockey schtick, only not from trees but from ice.
Oh, dear... very different. Who could have known?
Radical Rodent
1. That graph is mislabelled: it says the time axis is years before present, with present being 2000AD. This is wrong, the GISP2 data uses the more conventional 1950 as the baseline for BP and ends in 95BP, meaning 1855AD, thus missing any AGW. If you add in modern temperatures the plot looks like this.
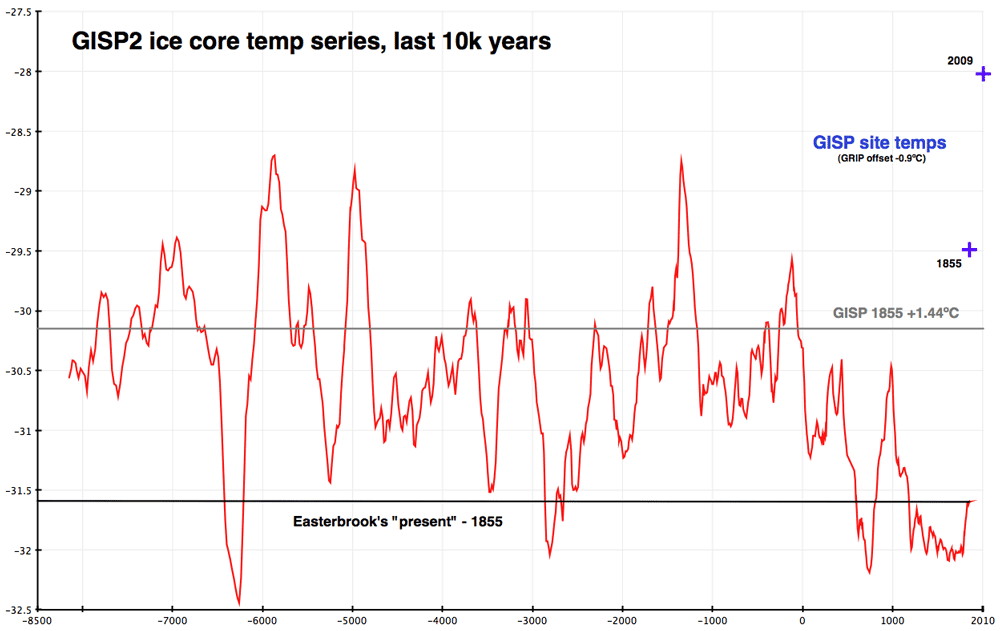
2. The data is correctly credited to Richard Alley. Shall we see what he says?
First off, no single temperature record from anywhere can prove or disprove global warming, because the temperature is a local record, and one site is not the whole world. One of the lessons drawn from comparing Greenland to Antarctica and many other places is that some of the temperature changes (the ice-age cycling) are very widespread and shared among most records, but other of the temperature changes (sometimes called millennial, or abrupt, or Younger-Dryas-type) are antiphased between Greenland and the south, and still other temperature changes may be unrelated between different places (one anomalously cold year in Greenland does not tell you the temperature anomaly in Australia or Peru). After scientists have done the hard work of working out these relations, it is possible to use one ice-core record to represent broader regions IF you restrict consideration to the parts that are widely coherent, so it is O.K. to plot a smoothed version of an Antarctic temperature record against CO2 over long times and discuss the relation as if it is global, but a lot of background is required.
Second, although the central Greenland ice-core records may provide the best paleoclimatic temperature records available, multiple parameters confirm the strong temperature signal, and multiple cores confirm the widespread nature of the signal, the data still contain a lot of noise over short times (snowdrifts are real, among other things). An isotopic record from one site is not purely a temperature record at that site, so care is required to interpret the signal and not the noise. An extensive scientific literature exists on this topic, and I believe we are pretty good in the community at properly qualifying our statements to accord with the underlying scientific literature; the blogospheric misuses of the GISP2 isotopic data that I have seen are not doing so, and are making errors of interpretation as a result.
[…]
So, using GISP2 data to argue against global warming is, well, stupid, or misguided, or misled, or something, but surely not scientifically sensible. And, using GISP2 data within the larger picture of climate science demonstrates that our scientific understanding is good, supports our expectation of global warming, but raises the small-chance-of-big-problem issue that in turn influences the discussion of optimal human response.
Source
The graph was prepared by Don Easterbrook, an unreliable source; full critique here.
Phil Clarke
Nov 28, 2017 at 12:07 PM | Phil Clarke
Should Peterson Connolley and Fleck 2008 be relabelled "Climate Science Fiction Mythology", bearing in mind that Peterson was a coauthor of Karl 2015, Connolley adjusts Wikipedia to suit his agenda, and Fleck is a science journalist?
Nov 28, 2017 at 10:47 AM | Radical Rodent
For such a "localised" civilization, the Minoans must have used a lot of fossil fuels. How did the Polar Bears survive without Greenpeace to save them?
golf charlie
The NoTricksZone article is headed with a graph from Starr & Oort (1973), and cites the paper extensively to support the claim of 'abrupt cooling' and also a NAS paper from 1975, For example this quote
" [T]here is a finite probability that a serious worldwide cooling could befall the earth within the next hundred years. … [A]s each 100 years passes, we have perhaps a 5 percent greater chance of encountering its [the next glacial’s] onset.”
and here's the bit Mr NoTricks left out of his quote
" There seems little doubt that the present period of unusual warmth will eventually give way to a time of colder climate, but there is no consensus with regard to either the magnitude or rapidity of the transition. The onset of this climatic decline could be several thousand years in the future, although there is a finite probability that a serious worldwide cooling could befall the earth within the next hundred years. ... "
As fine an example of selective quotation as one could wish for. And what of Starr & Oort? Well NTZ does not want you to know about a paper published a year later in the same journal with this abstract:
RESULTS reported by Starr and Oort reflect changes which have occurred in the instruments, in the methods used at the observing stations to interpret radiosonde measurements, and from the setting up of new stations, rather than from real geophysical changes
Selective quotation and ignoring a rebuttal paper. But no 'tricks', no Sir.
LOL.
Phil Clarke
And what does 'image source: NASA' mean?
Given that we're in a 'no tricks' zone.
Phil Clarke
Fair enough, Mr Clarke (Nov 28, 2017 at 12:07 PM). But, if you look really, really carefully, you will see that today’s temperatures are considerably below those of the Mediæval Warm Period, which was cooler than the Roman Warm Period, which was cooler than the Minoan Warm Period. As hockey sticks go, it is one that would give any player quite a few splinters.
“First off, no single temperature record from anywhere can prove or disprove global warming, because the temperature is a local record…” Cannot disagree with that one, either; it is good to see that you agree that a graph based upon a few trees in one area of the globe could give faulty results.
You will note that no-one you are arguing with, on this site, has said that there has been NO global warming; most just question whether it is unprecedented (which so much evidence suggests it is not), man-made (for which there is no real evidence that it is so), or catastrophic (for which there is absolutely no evidence, whatsoever).
Radical Rodent
But, if you look really, really carefully, you will see that today’s temperatures are considerably below those of the Mediæval Warm Period, which was cooler than the Roman Warm Period, which was cooler than the Minoan Warm Period.
?? The temperature for 2009 (the blue cross, far right) was -28, At least 0.5 warmer than any previous 'warm period'.
Phil Clarke
Selective quotation and ignoring a rebuttal paper. But no 'tricks', no Sir.
LOL.
Nov 28, 2017 at 1:27 PM | Phil Clarke
Is it time for Peterson Connolley and Fleck to be rebutted? Their myth, remains mythical, their paper remains a "Trick", and all to support Mike's original overcooked whopper.
golf charlie
The thread has drifted towards "GHG Theory Step by Step Deceptions".
Did any Climate Scientists actually withdraw from the IPCC process, because of Mann's Hockey Stick?
golf charlie
Mike's nature trick, of course. The concatenation of proxy data with temperature records in order to hide the fact that the proxies did not match the data in the period where thermometer figures exist.
Never happened in ant hockeystick paper MBH. Yet another myth. The full quote is
The paper in question is the MBH98 and the ‘trick’ is just to plot the instrumental records along with reconstruction so that the context of the recent warming is clear.