 Bishop Hill
 Climate correspondents
 Jan 7, 2013
  Climate: Statistics
  Climate: Surface
 Doug Keenan has followed up on his observations about the long-term rainfall records for England and Wales with an exchange of emails with Julia Slingo, the chief scientist at the Met Office. (Note that images can all be enlarged by clicking on them).
Dear Julia,
On November 12th, I sent an e-mail, in which you were Cc’d, about the statistical analysis of (observational) climatic data that has been done by the Met Office. My e-mail stated that some of the analysis is so incompetent that it “is not science”. It then asked if scientists at the Met Office had training in the relevant branch of statistics—i.e. in time series.
You did not reply to that e-mail. In consequence, on November 29th, Lord Donoughue put the following Question in the House of Lords.
To ask Her Majesty's Government how many scientists employed by the Met Office spend at least half of their working time conducting work closely related to global warming; how many of those scientists have taken an undergraduate-level course in statistical analysis of time series; and how many of those scientists have taken a graduate-level course in the statistical analysis of time series.[HL3705]
The Answer does not seem to have been published, but Lord Donoughue has told me that the Met Office claims that it has tens of scientists who have at least some training in the statistical analysis of time series. Specifically, the Answer claims that there are tens of scientists who understand that modeling autoregression is essential in such analysis. That is very good to learn. I find it difficult to believe, though, given the analyses previously produced by the Met Office.
Yesterday, the Met Office issued a news release about 2012 weather statistics:
http://www.metoffice.gov.uk/news/releases/archive/2013/2012-weather-statistics
The news release indicated that rainfall is increasing. It gained considerable attention, e.g. at the BBC and Channel 4.
The news release is largely based on a statistical analysis of rainfall data. Few details are given, but it is obvious that the analysis did not properly model autoregression. When proper modeling is done, I am confident that there will not be a significant increase in either rainfall or extreme rainfall events. Indeed that would be obvious to anyone knowledgeable in time series.
I ask that the Met Office address the statistical issue responsibly—specifically, via the following.
1. Promptly issue a news release stating that the statistical analyses that underpinned yesterday’s claims about increasing rainfall were invalid.
2. Implement procedures to ensure that news releases based on statistical analyses are vetted by someone competent in the relevant statistics.
Sincerely, Doug
Slingo's response was as follows:
Dear Doug,
Thank you for your email.
Yesterday’s announcements report on the UK’s observed rainfall records. What was announced was that provisional data show that 2012 was the second wettest year in the UK national record, along with preliminary research on the frequency of 1 in 100 day rainfall events over the last 50 years. A few points in particular stand out:
- 2012 is one of the wettest years on record (since 1910).
- Two months last year (April and June) were the wettest in a series back to 1766.
- Annual rainfall totals for UK are higher in recent years than during the 20th century.
- 4 of the 5 wettest years have been since 2000
- We have observed more wet days (>99th percentile) in recent years than a few decades ago.
These are basic conclusions from the observational record and make no attempt at defining trends, or attributing causes, not least as the observational record of daily rainfall records is not sufficiently long to derive robust statistics.
The widespread coverage of the observed data reflect the real impact that the rain has had on people and the nation’s infrastructure in recent years.
Regards,
Julia
Keenan has now responded in turn:
Dear Julia,
Your message cites “a series back to 1766”. I did not previously realize that the Met Office had precipitation data going back that far. Having such data is highly valuable, of course, and much facilitates analysis.
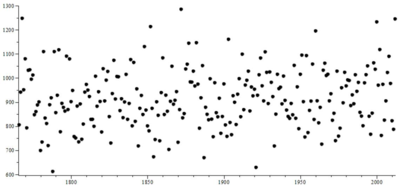
The cited series is not for the whole UK, but rather for England & Wales. That is fine though, especially as nine out of ten UK residents live in England and Wales—so this is what most people will be concerned about. I appreciate that data for the earlier years might be somewhat inaccurate. Using the annual data, though, should help to smooth out problems (i.e. the errors probably partially cancel each other out). Thus, this all seems to be fair. A plot of the annual data is below.
From the plot, it appears that we should not have concern about recent annual precipitation being overly high. Moreover, during the last decade, 2011 (787 mm) and 2003 (761 mm) are particularly low.
By omitting the above plot, and any mention of the information in the plot, the Met Office would seem to have misled the public and the media. Consider this: if a listed company reported on its financial position, and omitted data that was as material to its position as the above plot is to the state of precipitation, the people who were responsible would probably face prosecution.
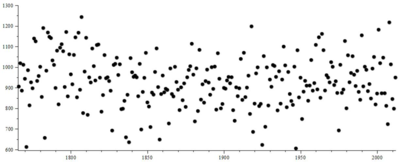
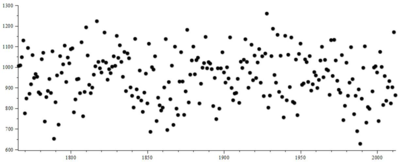
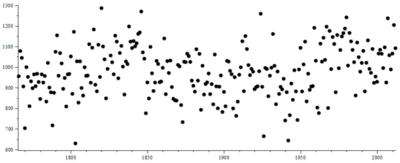
The precipitation data seems to be a somewhat like (fractional) Brownian motion, which is a type of random process. Some plots that were generated using Brownian motion are appended, for comparison. I am not claiming that precipitation actually is Brownian, merely suggesting that if the Met Office wanted to do research on the precipitation data, that might be a place to start.
Your message also cites some more recent observational data and indicates that such data supports the suggestion of significant increases. That is not possible, even in principle. In statistical analysis, inferences are not drawn directly from data. Rather, a statistical model is fit to the data, and inferences are drawn from the model. We sometimes see statements such as “the data are significantly increasing”, but this is loose phrasing. Strictly, data cannot be significantly increasing, only the trend (etc.) in a statistical model can be.
If we use a Brownian process as the model for the annual data, then there is no significant increase. Perhaps some non-Brownian models would be better, however, and would support an increase. If so, then it is the responsibility of the Met Office to select models to substantiate that. The Met Office, however, apparently has nothing to substantiate that. It has not even selected any model. And the same is true for the daily data.
It is because the Met Office has repeatedly had such serious failures in its statistical analyses that Lord Donoughue put his question in the House of Lords. In answer to the question, the Met Office apparently assured Lord Donoughue that it does have the requisite statistical expertise. Yet now, it issues a news release based on work that is so incompetent that if the work were submitted in an introductory (undergraduate) course, the student would flunk.
The answer to the question put by Lord Donoughue specifically acknowledged that modeling autoregression is essential. Did the “preliminary” research by the Met Office consider autoregression? No. Is it plausible that research that does consider autoregression will support an increase in precipitation? No. Was the Met Office aware that there is no valid evidence for an increase when it issued its news release? Either it knew, and thus acted fraudulently in issuing the release, or it was misleading when it told Lord Donoughue that it has the requisite expertise. (I suspect the latter.)
Taxpayers pay for the Met Office to provide expertise with climatic analysis. They are not getting anything close to what they pay for.
Sincerely, Doug
Sample plots generated via Brownian motion (the variance and dimension are as per the precipitation data):


Reader Comments (69)
If the four plots were placed side by side, could anyone guess which was real data and which were the fake ones?
Well said, geronimo.
I'd be tempted to call for an official enquiry into the Met Office, motivated by just the kind of things you have pointed out. But recent climate-related enquiries have been sick jokes, as so ably described in 'Hiding the Decline'.
Is there still a National Audit Office? I do recall that body having produced some penetrating analyses of poor performance by government departments and agencies.
On the one hand, a massive increase in budgets. On the other, a massive increase in what exactly?
Compare pretentions with performance. That could be the remit.
'pretensions'
Global warming will mean hotter drier summers according to the Met Office.
Perhaps this is incredibly naïve but why does the MET Office not model a parallel set of models with the assumption that there is no AGW with unadjusted data sets, predictions and forecasts from their (I assume) current AGW flavoured projections could be placed next to the non AGW output and checked against observations?
This malarkey where they point out a couple of flooding events due to rain is a tad amount to what sceptics get accused of when we point out snowfalls and are told weather is not climate.
"Global warming will mean hotter drier summers according to the Met Office.
Jan 8, 2013 at 11:38 AM | Neil Craig"
And colder wetter summers, colder drier summers, warmer wetter summers, with warmer wetter winters, colder drier winters as well as colder snowy winters. You haven't been paying attention to the utterances emanating from the Met Office Neil. They've forecast everything and the only solace we can take is that the reality will be 180 degress out of phase with the reality, when the Met Office will announce that this too, whatever it is, is more proof of global warming.
Not one mention of the lack a adequate infrastructure with regard to flood defences, something that has fallen upon deaf ears for the last 25 years. When I used to work for Thames Water in the 70s, flood defences were all the rage, with this or that flood alleviation scheme either in full construction or planning & preparation mode, usually of course in or around the Greater London area, although not exclusively so. Then privatization followed in the 80s, the responsibilities for water supply & sewerage were separated from that of catchment area control for rainwater surface run-off, the former being handed over to the private sector eventually to make huge profits for foreign businesses, with no legal obligation to provide adequate supplies of potable water to its customers whether through water retention storage or leak prevention, the latter being handed to the newly formed Environment Agency, poorly funded with a different remit, with much in the way of flood alleviation schemes to complete but with no dosh with which to complete them! Then when the expected rainfall came at its predicted 1 in 50 & 1 in 100 year events, surprise, surprise, localised flooding of catchment areas occurred, to great gasps of horror & amazement as if some deity had placed a curse upon us all from on high! Oh how short the memories can be, Dame Julia et all seem to defer to some mystical happening called Global Warming to explain away the almighty balls-ups & rank incompetences heaped upon us at vast taxpayer expense! Yet again we are to be considered to be Thick As Pig Sh1t (TAPS) to be fooled by the "worst since records began" scam, demonstrating that such events had clearly happened before, & will happen again!
geronimo wrote:
...its research arm should be closed down so that it can focus on forecasting the weather. The obsession with global warming and climate research is distracting it...
Yes and no - the problem the Met Office faces lies, I think, in the point made by Doug Keenan in his email exchange. Doug wrote that
So imagine a game of chance where you have to bet on the likelihood of a heads or tails result. Is there anything fishy or statistically unlikely about the result heads, heads, heads, heads, heads, heads, heads, heads, heads, heads, heads, heads, heads, heads, heads? Is the game fixed?
Well, the answer depends on your statistical model. If your model is that you are tossing a coin, then yes, those results, while feasible, are not going to happen very often. If, on the other hand, those are the results from rolling a ten-sided die that has 'heads' written on nine of its faces and 'tails' on the other, then there is nothing unexpected or significant about that sequence at all.
Thus, whether a particular set of data is surprising, unusual, or significant depends on what your prior model tells you to expect the outcomes to be. If your model were the results you'd get from flipping a coin, then you'd be surprised, but if it were rolling a die, then not.
The problem the Met Office may have is that it has corporately taken the CAGW shilling and therefore is working with the assumption that the climate is warming. If this premise is false, then they have an even worse chance of forecasting the weather accurately than they would anyway. They are forecasting based on the probable results of a coin toss, when the weather is, in fact, rolling dice.
The correct solution is to abandon the flawed model and try another, but in the meantime there's lots of money to be lost by doing so, lots of opprobrium from green scum for doing so, and no reward at all. And anyway, when the wheels do conclusively fall off, they can all claim they did nothing wrong because everyone else believed it all too. So there are lots of bad consequences from 'fessing up, but none at all from persisting with nonsense.
H/T Thomas Gibbon for the link to the 'Scientists' backgrounds at the MO.
On Julia Slingo's page is a link to their 'Science strategy':
http://www.metoffice.gov.uk/media/pdf/a/t/Science_strategy-1.pdf
IMO cAGW mantra buttered with bull*$%t - hardly surprising that there is little factual output from an outfit with this sort of guidance.
Now that news of the revised MET temperature forecasts (projections?) is out Dr Stott (as reported in the Telegraph) still warns that global warming "could speed up again at any time". If he really has no idea about what's going to happen, wouldn't he be better to say as much? Or perhaps to do so would be 'off message'.
The best way to check the trends is to use Mann's lowpass.m function with minimum roughness option:
http://www.climateaudit.info/data/uc/HadUKP1.png
A clear trend is seen for the last 100 years. The change has been rapid, by removing the year 2012 we get something different:
http://www.climateaudit.info/data/uc/HadUKP2.png
Todays BBC Radio 4 Today at 7, about the second item led with the story the startling news that GW had now been officially postponed until 2019, due to ocean currents affecting things in an unpredicted way according to the Met Office. Not a jot about this on the Met Office web site, or the web BBC news headlines page. Interesting that!
I hope Ms Slingo doesn't forget other factors when she speaks of people being affected by rain.
Only a few years ago I knew a sea-defences engineer from North West England. He later went to the Environment Agency in the South West and told me about some dubious practices of residential-construction companies wishing to build on flood plains, but needing a "good" report on flood risks from the Agency for the sites in question. In the future, people are going to suffer hardships when their houses flood and become uninsurable.
It will, of course, be blamed on global-warming.
One of the leaders in today's Telegraph suggest that today's masons shoud take a leaf out of their medieval predecessors book when it comes to dressing stonework.
Along the same lines we should remind today's builders that the term 'flood plain' is trying to tell them something! And I feel no more inclined to have my taxes spent on protecting homes recently built in eminently and predictably stupid places, than I do to demolish our industries because some nutter decided to settle on low-lying uninhabited Tuvalu for the first time in 1750.
I'm the first to stand for individual liberty in decision making. But that isn't the same as expecting me to dig somebody out of self-inflicted stupidity.
Phil R
Thanks for the link (and CarpetDM, Phil was its source).
One approach is to locate the Met Office's technical 'conscience' (every organization has one), identify its members (usually about 5 people), assess their competence (in climate science), and locate it in the management hierarchy.
The other way is to start with the top management and work down.
I'll do both.
This link is a useful start.
The main caveat about Global Warming (not necessarily H2O or CO2 related) is that if we have two trends out of phase e.g. sun cooling (low activity) and increasing man-made warming , then they will tend to cancel out, producing periods of small changes in temperature. However when the trends get into phase (sun resumes warming) then we will get back to very rapid increases.
(Only a fool doesn't believe in climate chage - after all we have had ice ages and interglacial periods without mankind's assistance, the question is whether it is being assisted significantly by human activities - on which the jury is out)
You don't need "tens" of stats gurus in a department, just a few, or even one. Here's how it works. I got an idea, sketched it out, estimated sample size, measures, data and suitable analyses. I toddled off down the corridor to Mike. He listened patiently while I outlined my ideas. He equally patiently explained to me that my sample size, data or proposed analyses were a bit skew-wiff. He gave me some papers to read. I read them, then I went back and talked to him some more. I read the guidance notes for at least two heavyweight computer stats packages.
There's more, but to cut a long story short, it would end up with me showing Mike the stats printout. He listened patiently to my interpretation, which he commended, critically evaluated, or shot dead.
Mike had his name on more academic papers than anyone in the department. I miss him. (not dead, just moved to a better job).
THAT'S what the Met office needs. A MIKE.
As Geronimo points out " Public Servants should be exposed when they manufacture conclusions"
In Australia, a federal gov minister on a visit to Saibai Island (just of the New Guinea coast) said that the sea level had in the last decade risen by a few feet 'as result of Global warming' . When it was pointed out that the sea had not appeared to have risen so, anywhere else, the reply was that the advice of the Nation Premium Scientific Body was the source of the observation.
Presumably, sealevel is nolonger an equipotential surface. It mst rank as the greatest discovery since Newton !.
Using the 5 basic 'weather superlatives' - wettest, driest, hottest, coldest and windiest - combined with an appropriate unit of time - decade, year, season, month, or 'since records began', there are 125 possible superlatives. When you allow for the 2nd wettest, driest etc, there are obviously 250, (enough to allow the Met Office to make I such announcement every month for more than 20 years!) When you throw in more time measurements like 'since 1998' or 'since 1971' or 'this century or 'since we got our latest fucking great computer', plus other fancy combinations like 'the three wettest years occurring in the last 10 (or 20 or 30 etc) years, the permutations become mind numbingly infinite.