


Discussion > GHG Theory step by step
The hockey stick graph remains an illusion
Tellingly, in his response, Montford does not dispute the factual errors. Just where in the book they appear.
Still not on my reading list.
 Phil Clarke
Michael Kelly is entitled to his opinion, of course. He is, after all a writer of parody.
Allegedly.
Phil Clarke
"Montford's entertaining conspiracy yarn reaches two apparently devastating conclusions about the work of climate scientists, partly based on his analysis of the hacked email messages."
Mar 6, 2018 at 11:17 PM | Phil Clarke
"The Hockey Stick Illusion" by Andrew Montford was WRITTEN before ClimateGate and the release of E-Mails, so your expert opinion is flawed from the outset.
golf charlie
Still not on my reading list.
Mar 7, 2018 at 7:59 AM | Phil Clarke
Are you allowed to choose your own reading list?
golf charlie
"The Hockey Stick Illusion" by Andrew Montford was WRITTEN before ClimateGate and the release of E-Mails, so your expert opinion is flawed from the outset.
No. Chapter 10 is entitled 'The CRU hack'.
The last chapter of the book deals with what the book calls "Climategate". Here, the author compares several e-mails to the evidence he presents in The Hockey Stick Illusion. Montford focuses on those e-mails dealing with the peer review process and how these pertained to Stephen McIntyre's efforts to obtain the data and methodology from Mann's and other paleoclimatologists' published works
You obviously share Montford's respect for accuracy.
BTW the exchange in the comments to Tamino's review at RC between Judith Curry and Gavin Schmidt are illuminating.
Phil Clarke
Mr Clarke: odd, how you so cheerfully admit that you depend on others to help you form your opinions, and don’t bother doing your own research.
JayJay: I can understand your concerns about change of land use causing climate change, however, any change will be local, and probably of little significance, overall. While there are vast swathes of land that have been altered by human activity, it remains a relatively small proportion of the total land area. Then you have to consider that the total land area of the planet is less than half that of the oceans, so it is probably oceans that have the greatest influence on global climate (if such a thing can be considered to exist) – remember how el Niño and la Niña can have such far-reaching effects, when they occur. Those who are studying the decadal oscillations of the oceans have managed to present more accurate projections than the more widely-known GCMs; but there is no way that we can even pretend that we can have some control over the oceans. Climate change is a completely natural phenomenon that has been ongoing since the birth of the Earth, 4,500,000,000 years ago; the only difference between the present change and the previous 99.99999% of changes that have occurred is that we are around to observe it. However, there are a sufficiently significant number of people, and in significantly influential positions to have hijacked this natural phenomenon for their personal advantage – be it to increase their wealth, fame, influence, power or any or all combinations of those.
Radical Rodent
Phil Clarke:
The next (the GISP2 data) is from a single site in Greenland, the scientist who curates the data described using the data this way as 'stupid, or misguided, or misled, or something, but surely not scientifically sensible.'
Both (it being a 'single site' and one person's opinion) are incorrect or irrelevant IMHO.
GISP2 is ice-core data, as a temperature or CO2 proxy this is well known and often used. The number of locations were we can collect ice-cores are rather limited. For NH close to pole I do not think there is any better place than Greenland. And this GISP2 data does not stand alone, see below for the SH data (Vostok, which I also mentioned in previous post).
GISP2 is collected and published by a large group of people ( http://www2.umaine.edu/GISP2/proglist.html ), it is not owned by a single person.
And from the interview you link to it is clear that he has an opinion, but it is merely that. Nothing what he says really undermines the data.
After publication other people may then also analyze this data, that is a normal practice in science. Unless the data can be proven to be substantially incorrect the conclusions stand as they are. It would require much too many corrections to the recorded data to be able to come to other conclusions.
Dr Alley does NOT say that this data is incorrect, he warns about interpretation and detailed accuracy. The latter is a well known issue, such as there may be several years missing / miscounted (due to compression of ice layers & failure to detect that). But that won't help explaining major deviations from what is expected.
Sure the signal of a historic volcano may end up a few years off (due to miscounting years), but that can be corrected based on volcanic fingerprint and after that the GISP2 detailed time-line can be corrected.
And such minutiae are irrelevant at the much longer timescales that we are talking about. The data pretty much speaks for itself.
Also we are talking here about the relative development in the same ice-core record of a temperature proxy and CO2, in the same layers, regardless whether that layer is dated exactly. The sequence is clear.
And in fact Dr. Alley says: "... so it is O.K. to plot a smoothed version of an Antarctic temperature record against CO2 over long times and discuss the relation as if it is global, but a lot of background is required."
Indeed. Part of that background being that this signal is not isolated to the NH ice cores, it is also visible in the SH ice cores...
With some differences of course (such as that the SH Law Dome ice core shows a downward trend in temperature over the last 2000 years, despite recent partial recovery ... McIntyre - New Antarctic Temperature Reconstruction)
And: "demonstration that there have been large climate changes in the past without humans in no way demonstrates that humans are not now responsible. "
To which one can say: no, but it still does prove that the climate has changed a lot in the past WITHOUT any help from humans (or CO2).
None of this disproves this data!
By the way he also says: "I just happen to have a personal bias (shared, I believe, by the majority of the six-plus billion people on the planet) that we should ask what is best for humanity, and pursue that. An opinion, surely, and not purely scientific, but that’s my bias."
Ho hum, so he says that he is biased, he is a believer, but warns about running with the data ...
I appreciate his honesty, but I'm afraid I will have to trust the data.
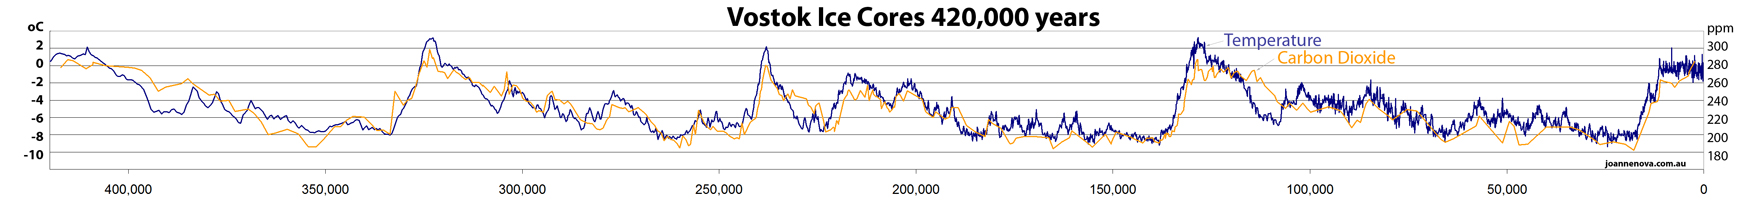
The other location possible for this kind of data is Antarctica, and the last one I mentioned was Vostok, which is on Antartica:
The 800 year lag in CO2 after temperature – graphed
it tells the same story: CO2 comes AFTER temperature.
For the longest graph see bottom of that page (or direct: http://joannenova.com.au/globalwarming/graphs/VostokIceCores400000Kmed.jpg )
So SH ice-core confirms NH ice-core: CO2 follows temperature by a long delay in climate history.
All are from non peer reviewed sources
Really?
Vostok:
REFERENCES
Petit et all 1999 — analysed 420,000 years of Vostok, and found that as the world cools into an ice age, the delay before carbon falls is several thousand years.
Fischer et al 1999 — described a lag of 600 plus or minus 400 years as the world warms up from an ice age.
Monnin et al 2001 – looked at Dome Concordia (also in Antarctica) – and found a delay on the recent rise out of the last major ice age to be 800 ± 600
Mudelsee (2001) - Over the full 420,000 year Vostok history Co2 variations lag temperature by 1,300 years ± 1000.
Caillon et al 2003 analysed the Vostok data and found a lag (where CO2 rises after temperature) of 800 ± 200 years.
http://joannenova.com.au/2009/12/carbon-rises-800-years-after-temperatures/
Petit, J.R., Jouzel, J., Raynaud, D., Barkov, N.I., Barnola, J.-M., Basile, I., Bender, M., Chappellaz, J., Davis, M., Delaygue, G., Delmotte, M., Kotlyakov, V.M., Legrand, M., Lipenkov, V.Y., Lorius, C., Pepin, L., Ritz, C., Saltzman, E., and Stievenard, M. 1999. Climate and atmospheric history of the past 420,000 years from the Vostok ice core, Antarctica. Nature 399: 429-436. [Discussion, CO2science]
Fischer, H., Wahlen, M., Smith, J., Mastroianni, D. and Deck B. 1999. Ice core records of atmospheric CO2 around the last three glacial terminations. Science 283: 1712-1714. [Discussion, CO2science]
Monnin, E., Indermühle, A., Dällenbach, A., Flückiger, J, Stauffer, B., Stocker, T.F., Raynaud, D. and Barnola, J.-M. 2001. Atmospheric CO2 concentrations over the last glacial termination. Science 291: 112-114. [Discussion, CO2science]
Mudelsee, M. 2001. The phase relations among atmospheric CO2 content, temperature and global ice volume over the past 420 ka. Quaternary Science Reviews 20: 583-589.
Caillon, N., Severinghaus, J.P., Jouzel, J., Barnola, J.-M., Kang, J. and Lipenkov, V.Y. 2003. Timing of atmospheric CO2 and Antarctic temperature changes across Termination III. Science 299: 1728-1731. [Discussion, CO2science]
JayJay
Radical Rodent:
Then you have to consider that the total land area of the planet is less than half that of the oceans, so it is probably oceans that have the greatest influence on global climate (if such a thing can be considered to exist) – remember how el Niño and la Niña can have such far-reaching effects, when they occur.
Oh I agree. As I indicated I'm merely wondering why H2O is ignored to such an extent compared to CO2. It is a GHG just like CO2. Sure when too much is in the air we can get clouds and rain, which cools not warms.
But the GHG content of the atmosphere is 95% H20 and just 4% CO2. What matters is that content.
H2O is recycled at a much higher rate than CO2, which compensates for much shorter duration of H2O. For any GHG warming effects what matters is the presence at any point in time, the content. And not the duration of the life-cycle of a single molecule.
And the direct changes to H2O content due to a.o. argriculture are much larger (other order of magnitude, more than 10%) than any (theoretical) increase due to warming due to CO2 (max a few percent). On top of that H2O has a much broader absorption frequency range than CO2.
So assuming the GHG theory is correct than we still have the issue that the direct warming caused by H2O (alone) must be much bigger than that caused by CO2 directly.
Whatever warming remains for CO2 alone must be tiny indeed.
JayJay
Hi, I'm JayJay and I approve of this message:
C. D. Idso and K. E. Idso - Carbon Dioxide and Global Warming - Where We Stand on the Issue
There is little doubt the air's CO2 concentration has risen significantly since the inception of the Industrial Revolution; and there are few who do not attribute the CO2 increase to the increase in humanity's use of fossil fuels. There is also little doubt the earth has warmed slightly over the same period; but there is no compelling reason to believe that the rise in temperature was caused by the rise in CO2. Furthermore, it is highly unlikely that future increases in the air's CO2 content will produce any global warming; for there are numerous problems with the popular hypothesis that links the two phenomena.A weak short-term correlation between CO2 and temperature proves nothing about causation.
Proponents of the notion that increases in the air's CO2 content lead to global warming point to the past century's weak correlation between atmospheric CO2 concentration and global air temperature as proof of their contention. However, they typically gloss over the fact that correlation does not imply causation, and that a hundred years is not enough time to establish the validity of such a relationship when it comes to earth's temperature history.The observation that two things have risen together for a period of time says nothing about one trend being the cause of the other. To establish a causal relationship it must be demonstrated that the presumed cause precedes the presumed effect. Furthermore, this relationship should be demonstrable over several cycles of increases and decreases in both parameters. And even when these criteria are met, as in the case of solar/climate relationships, many people are unwilling to acknowledge that variations in the presumed cause truly produced the observed analogous variations in the presumed effect.
In thus considering the seven greatest temperature transitions of the past half-million years - three glacial terminations and four glacial inceptions - we note that increases and decreases in atmospheric CO2 concentration not only did not precede the changes in air temperature, they followed them, and by hundreds to thousands of years! There were also long periods of time when atmospheric CO2 remained unchanged, while air temperature dropped, as well as times when the air's CO2 content dropped, while air temperature remained unchanged or actually rose. Hence, the climate history of the past half-million years provides absolutely no evidence to suggest that the ongoing rise in the air's CO2 concentration will lead to significant global warming.
...
JayJay
Richard Alley is pretty much the go-to guy on ice cores, heck, he wrote the book.
I hate to see him quoted so selectively; let us restore some context,
First off, no single temperature record from anywhere can prove or disprove global warming, because the temperature is a local record, and one site is not the whole world. One of the lessons drawn from comparing Greenland to Antarctica and many other places is that some of the temperature changes (the ice-age cycling) are very widespread and shared among most records, but other of the temperature changes (sometimes called millennial, or abrupt, or Younger-Dryas-type) are antiphased between Greenland and the south, and still other temperature changes may be unrelated between different places (one anomalously cold year in Greenland does not tell you the temperature anomaly in Australia or Peru). After scientists have done the hard work of working out these relations, it is possible to use one ice-core record to represent broader regions IF you restrict consideration to the parts that are widely coherent, so it is O.K. to plot a smoothed version of an Antarctic temperature record against CO2 over long times and discuss the relation as if it is global, but a lot of background is required.
There's no evidence in the graph from WUWT that any of these important caveats were observed.
What significance are you drawing from the fact that on glacial/interglacial timescales, CO2 lags temperature? At this scale, an initial forcing (often a change in planetary orbit or axial rotation) causes global warming, this releases CO2, mainly from the oceans which produces more warming. Naturally the feedback comes after the initial forcing. But the process was extremely gradual compared to the warming we are seeing due to the release of gigatonnes of CO2 by digging up and burning fossil fuels.
Phil Clarke
"To establish a causal relationship it must be demonstrated that the presumed cause precedes the presumed effect"
Only if there is a single cause. Just maybe the climate system is a little more complex.
A car is stationary on a flat road at the top of a hill, it receives a push, then picks up speed as it rolls downwards.
But gravity cannot be the cause of the motion as the effect (movement) preceded the cause. Right?
Phil Clarke
Mar 7, 2018 at 10:56 AM | Phil Clarke
You really ought to stop putting your faith in liars, and read the book, written before ClimateGate. Climate Science may be able to think of something, and publish it with Peer Review in a week or so. Further evidence of selective reporting of selected facts by Climate Science?
From Wikipedia:
"The Hockey Stick Illusion first outlines a brief history of climate change science with particular emphasis on the description of the Medieval Warm Period in the first IPCC reportin 1990, with its inclusion of a schematic based on central England temperatures which Montford describes as a representation of common knowledge at that time. He then argues that a need to overturn this "well-embedded paradigm" was met by the 1998 publication byMichael E. Mann, Raymond S. Bradley and Malcolm K. Hughes' of their "hockey stick graph" in Nature.[6] The book describes how Steve McIntyre first became interested in the graph in 2002 and the difficulties he found in replicating the results of "MBH98" (the original 1998 study) using available datasets, and further data which Mann gave him on request.[7] It details the publication of a paper by McIntyre and Ross McKitrick in 2003 which criticized MBH98, and follows with Mann and his associates' rebuttals. The book recounts reactions to the dispute over the graph, including investigations by the National Academy of Science and Edward Wegman and hearings held on the graph before theUnited States House Energy Subcommittee on Oversight and Investigations. Efforts taken by other scientists to verify Mann's work and McIntyre's and others' responses to those efforts are described.[8]"
"The last chapter of the book deals with what the book calls "Climategate". Here, the author compares several e-mails to the evidence he presents in The Hockey Stick Illusion.Montford focuses on those e-mails dealing with the peer review process and how these pertained to Stephen McIntyre's efforts to obtain the data and methodology from Mann's and other paleoclimatologists' published works.[9]"
golf charlie
Only if there is a single cause. Just maybe the climate system is a little more complex.
Mar 7, 2018 at 1:00 PM | Phil Clarke
What are the other causes of global warming and cooling that have been ignored by Climate Science and Mann's Hockey Stick?
golf charlie
Chapter 10 is entitled 'The CRU Hack' so, as the book was written before Climategate, Mr Montford must have either extraordinary clairvoyance or time travelling abilities in addition to his formidable skills as a storyteller.
Phil Clarke
.... not to mention the book's subtitle ;-)
Phil Clarke
Phil Clarke, since you have not read "The Hockey Stick Illusion", you appear to be unaware of its context and content, but happy to repeat the lies of others (who may not have read it either)
https://alethonews.wordpress.com/2010/03/15/the-case-against-the-hockey-stick/
"I was not the only one who was impressed. The graph appeared six times in the Intergovernmental Panel on Climate Change (IPCC)’s third report in 2001. It was on display as a backdrop at the press conference to launch that report. James Lovelock pinned it to his wall. Al Gore used it in his film (though describing it as something else and with the Y axis upside down). Its author shot to scientific stardom. “It is hard to overestimate how influential this study has been,” said the BBC. The hockey stick is to global warming what St Paul was to Christianity."
"And the hockey stick is wrong. The emails that were leaked from the University of East Anglia late last year are not proof of this; they are merely the icing on the lake, proof that some of the scientists closest to the hockey stick knew all along that it was problematic. Andrew Montford’s book, despite its subtitle, is not about the emails, which are tagged on as a last chapter. It is instead built around the long, lonely struggle of one man— Stephen McIntyre—to understand how the hockey stick was made, with what data and what programs."
golf charlie
Phil Clarke, which bits of Climate Science should be Taxpayer Funded?
golf charlie
Chapter 10 is entitled 'The CRU Hack' so, as the book was written before Climategate, Mr Montford must have either extraordinary clairvoyance or time travelling abilities in addition to his formidable skills as a storyteller.
Phil is right I think, the reason for some confusion may be given in the preface to the current, revised edition.
The Hockey Stick Illusion (Paperback)by A W Montford
https://www.amazon.com/Hockey-Stick-Illusion-W-Montford/dp/0957313527
The Preface discusses all kind of things, but is completely silent about Climategate.
Directly thereafter follows:
Preface to the revised edition.
...
Second, of course, was the advent of Climategate, just weeks before the book's publication.
So it seems that he included that last chapter after the book was already finished.
However, I'm not sure whether there has been an edition actually published without the Climategate chapter.
It may be that they simply held-off publication (just a very short time prior to the original publication date) in order to get that last chapter in. Maybe they decided on the latter, but that would have been an unplanned delay of at least a few months I would guess.
The story broke in November 2009, the book was first published March 2010 (according to Amazon).
"In November 2009, 4558 emails and other documents were obtained from a server at the Climatic Research Unit (CRU) at East Anglia University in the UK, either by a hacker or a whistleblower. They were posted on an anonymous Russian internet site, and a link was sent to a handful of websites critical of the theory of man-made global warming."
The March 2010 version already mentions Climategate in the subtitle, so I guess that the version without that chapter 10 was never published.
JayJay
There's no evidence in the graph from WUWT that any of these important caveats were observed.
It is from Climate4you I think. Big Picture link (http://climate4you.com/GlobalTemperatures.htm#An overview to get things into perspective) a bit below beginning http://climate4you.com/images/GISP2%20TemperatureSince10700%20BP%20with%20CO2%20from%20EPICA%20DomeC.gif
Also explains where the data is coming from.
And again note that the SH Ice cores show the same: CO2 follows temperature.
What significance are you drawing from the fact that on glacial/interglacial timescales, CO2 lags temperature? At this scale, an initial forcing (often a change in planetary orbit or axial rotation) causes global warming, this releases CO2, mainly from the oceans which produces more warming.
Well that things are not as simple as they are shown. Sure there can be multiple processes at work, so this can be a false signal.
However I also know that the temperature record has been altered, not just simply homogenized in order to be able to correctly combine them, but more (to create data for areas without any data at that time, such as Africa). And the corrections for the huge empty spaces seem to have been model-based guesstimates; problem is that this model already assumes a CO2 driven climate.
This means that when you take the unadjusted data, or any longtime series of any of the older main stations plus adjust that data by hand for changes, there is no correlation to CO2.
We know this because the adjustments themselves have a perfect correlation to CO2 (I posted that chart earlier).
Mostly the same happens when you take subsets from area's where there has been very little infilling (just corrections), such as for USA.
For a detailed analysis of the correlation issues for the data AFTER 1960, please see this page CO2 at climate4you.
The analysis starts halfway down. You can see section where the relation is positive, negative and weak or neutral.
A detailed analysis with more text is here: http://climate4you.com/ClimateReflections.htm#20080927: Reflections on the correlation between global temperature and atmospheric CO2 .
JayJay
Oops duplicate, sorry.
JayJay
Below link to that book (on this site) has in fact an even older cover, without the Climategate subtitle.
So this cover is older than the oldest March 2010 cover visible at Amazon.
http://www.bishop-hill.net/the-hockey-stick-illusion/
JayJay
Yeah - I suspect the book was about finished when the stolen email nothingburger broke, and Montford added an extra chapter. Whether there was ever an edition without chapter 10 is moot - because GC's criticism was that the Bob Ward review - dated Aug 2010 - was factually wrong for mentioning ClimateGate when clearly he was reviewing the version with the chapter.
I notice that in Mr Montford's rebuttal he describes himself 'astonished' that the Guardian would stand by Ward's article, especially after 'positive reviews started to appear, in the Spectator and Sunday Telegraph'.
Curious about those reviews I tracked them down. The ST has a piece by Christopher Booker on the so-called 'AmazonGate' IPCC scandal that devotes precisely 2 sentences to the HSI, while the Spectator article is by Matt Ridley writing about the contrarian blogosphere and taking in Anthony Watts, Steve McIntyre and Mr Montford, and devoting a single sentence to describing the book.
Positive they may be, but calling these pieces 'reviews' is stretching the truth, in my view.
https://www.telegraph.co.uk/comment/columnists/christopherbooker/7113582/Amazongate-new-evidence-of-the-IPCCs-failures.html
https://www.spectator.co.uk/2010/02/the-global-warming-guerrillas/
[As a footnote, it was the ST's AmazonGate articles that led to a humiliating apology and retraction. Something Booker knows something about]
Phil Clarke
Mar 7, 2018 at 5:21 PM | Phil Clarke
Another instance of you repeating disinformation.
Do you wonder why people who are unsure about the credibility of Climate Scientists, find "The Hockey Stick Illusion" by Andrew Montford so educational? It was written before ClimateGate. ClimateGate proved Montford, Steve McIntyre et al correct, and that Climate Science depended on deceit.
You refer to Climategate as being a hack. Do you have evidence for this, as the Police could not find any?
golf charlie
2003
http://michaelkelly.artofeurope.com/cru.htm