


Tuesday
Mar292016
by  Bishop Hill
Bishop Hill Sea ice holds firm
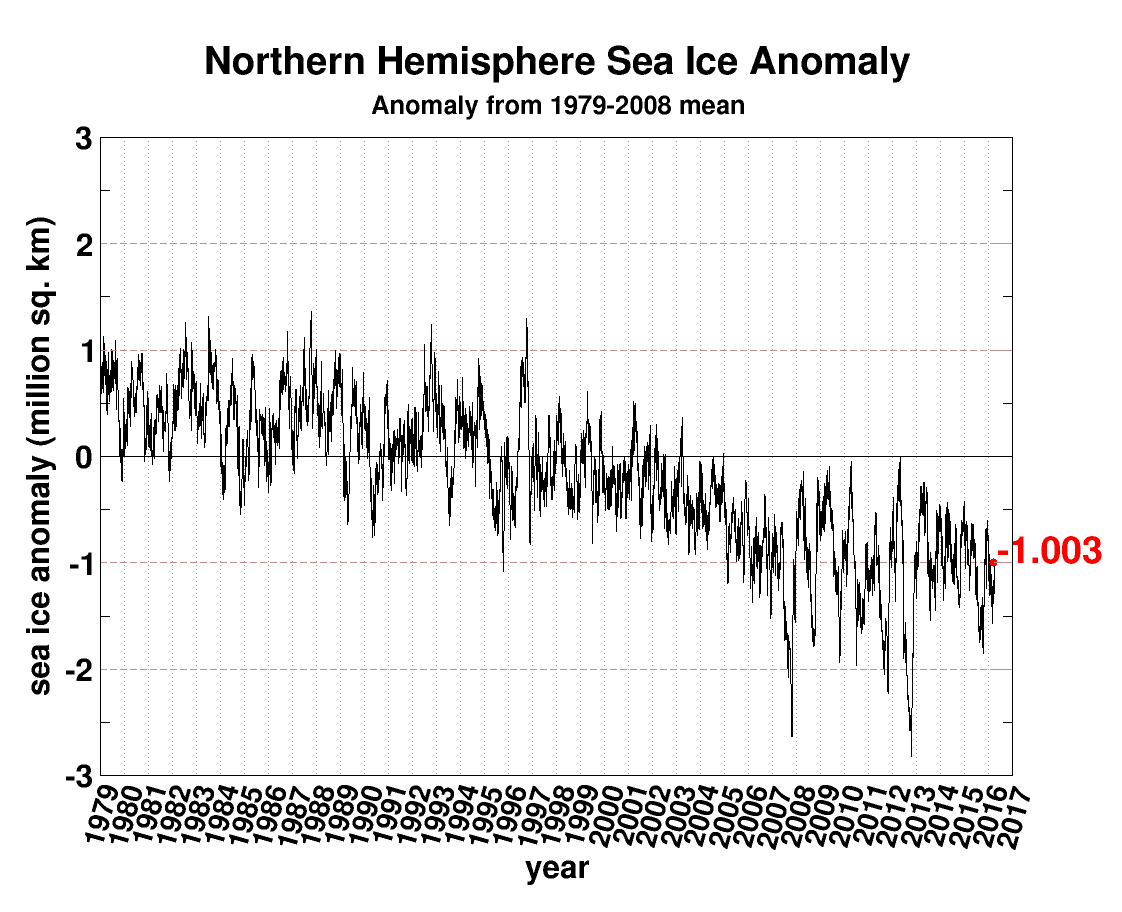
Climate: Oceans This morning's story appears to be the hoary old "Arctic sea ice in freefall" one.
The Arctic is in crisis. Year by year, it’s slipping into a new state, and it’s hard to see how that won’t have an effect on weather throughout the Northern Hemisphere,” said Ted Scambos, lead scientist at the Colorado-based NSIDC.
As usual on these occasions, I take a quick look at the Cryosphere Today anomaly page, where I find the sea ice apparently still stuck firmly in "pause" mode.
Reader Comments (278)
As far as I’m aware CO2, human or otherwise, doesn’t melt ice; there is nothing happening at the Arctic that hasn’t been observed and recorded before, even within the lifetime of some:
http://www.climate4you.com/images/70-90N%20MonthlyAnomaly%20Since1920.gif
my bank balance anomaly is -540 quid for march 2016
is that good or bad ?
I have no clue. Mind you, my average weighted and seasonally adjusted bank balance index is looking good.
anyone who starts to use persuasive statistically based language is trying to sell you a turd
How much ice is smashed every year by ice breakers, getting climate scientist in and out of ice, in order to tell us all how little ice there is left?
Polar ice has only ever been threatened by too much funding, for Climate scientist Ice Experts. There is a simple solution to this problem, and it will save millions of Pounds/Dollars, instantly.
Rising seas are a physical impossibility.
Too much warming you get increased evaporation
Too much cooling you get more ice
So the level of the seas must always remain same
Unless water is still been formed somewhere?
GC, 10:24pm:
Good point. And are we going to get an absolute reassurance from NERC that their newly commissioned ice-smasher RRS Boaty McBoatface is going to be ice-neutral, let alone carbon-neutral.
Perhaps they should dangle a few climate activists/scientists over the bow as fenders to ensure that no ice, polar bears or seals get harmed.
When a person of the caliber of gubulgaria speaks up, the mob must listen and learn.
Please, gubulgaria, teach these climate heathens what's what. Without your insights and contribution, everything is lost.
'Unless water is still been formed somewhere?'
It is still being accreted from space.
Today's February looks a hell of a lot like yesterdays August in the sea ice sweepstakes.
Ayla, it is only fair that Greenpeace activists, when sentenced to prison in the UK should be offered a cell without heating, lighting or power generated from fossil fuels. This would give Greenpeace activists the opportunity to demonstrate their opposition to fossil fuels before a captive audience, reknowned for their respect for dishonest people.
Never confuse NASA the great organisation of great scientists and engineers that put man on the moon, with NASA-GISS the not-so-great organisation in a non-descript upstairs office in some part of downtown NY (which ought to be permanently submerged by now).
What they are banging-on about, however, is the global combined TOTAL of Arctic + Antactic sea ice which can be seen (in blue) here on The Cryoshpere Today website . . . http://arctic.atmos.uiuc.edu/cryosphere/IMAGES/global.daily.ice.area.withtrend.jpg
This shows the most recent downward spike (corresponding to the Antarctic summer minimum) to be the lowest on the CT record.
But note that the same plot also includes a red line representing the ANOMALY. This shows that the lowest anomaly on record actually occurred in 2012 and the most recent minimum is not the lowest anomaly. (Go figure!)
None of the alarmists who are screaming about this seem willing to show what this 'minimum' looks like *on the ground*. The 'reality' can be gauged from this . . . http://nsidc.org/data/seaice_index/images/daily_images/N_bm_extent_hires.png
and this . . . http://nsidc.org/data/seaice_index/images/daily_images/S_bm_extent_hires.png
Basically what it boils down to: the NH maximum for this winter has been low (a patch of Barents Sea near Novaya Zemlya is to largely to blame) and SH minimum is back to average (whereas previously it had consistgently been above average)
Eli Rabett, how does this ice loss compare with the first half of the 1800s?
Will Ice Expert Mark Serreze be again reissuing his death spiral forecast? Is he going to alter it, or just photoshop one of the previous ones with a different date?
Perhaps you are unaware of Britain's embarrassing and tragic history over false hopes of Arctic ice melt. You can search Wikipedia for 'Franklin's Lost Expedition' if you have the slightest interest in learning something from the past, that might impact your future funding.
J Calvert N,
NASA-Goddard would be confused trying to intersect 2 lines on an Etch A Sketch, without computer adjusting a photo-shopped image. This may be why former NASA Astronauts don't want their reputations sullied by confusion with NASA-Goddard.
Eli Rabett, how does this ice loss compare with the first half of the 1800s?
There was much more sea ice in the first half of the 1800s
http://www.nature.com/nature/journal/v479/n7374/full/nature10581.html
No drastic loss.
The Canary in the mines still singing then?
So how long before they fiddle the data?
Oh look they already have....
https://notalotofpeopleknowthat.wordpress.com/2016/02/27/noaa-is-losing-arctic-ice/
J. Calvert N.
It is not NASA GISS in NY but NASA’s Goddard Space Flight Center in Maryland and they specifically mention the Arctic anomaly, not the Total.
An acquaintance mentioned a while back that every newspaper she's checked censors comments. She is now working her way through political blogs with the same result. The climate blogs I've checked, denier or not, also censor comments.
I was wondering, do you guys know of any online site of relevance that doesn't censor comments?
Can't wait to see how that cruise ship gets on....
Ayla, which sites have censored your pearlescent whirls of wisdom?
Ayla. No.
All sites censor comments because they wish to avoid what happened to that Microsoft racist bot. The tone of the site is set by the most emotional voices. And they are the most extreme.
In my opinion, the trick is to engage with sites that censor in opposite ways so as to avoid different extremes. It helps one avoid being swayed too much by ones peers.
For example, WUWT censors emotional and compassionate comments while the Guardian environment section censors technical responses. Together they provide balance.
It is a peculiar state of affairs.
On the Cryosphere website this graph sits beside Andrew Montford' s choice. It allows direct like with like trendcomparison between years, while Montford graph obscures the trend.
That he chose a graph which obscures the trend rather than a graph which reveals it speaks volumes about his propoganda motivation. That his self-chosen audience fell for it speaks volumes about their gullibility.
Beyond the fact of the ice, what has been the impact?
You don't half manage to miss the point sometimes, EM.
The graph you link to is no more indicative of trend than the one at the head of this post. Arguably. It is less informative. What I see on the anomaly graph is nothing much until 1997 then a 10-year decline and broadly a stabilisation since then.
Or a rough and ready match with global temperature anomalies .
I also see a lot of historical data that tells me that what is happening in the Arctic is same-old, same-old. Of course those old-timers didn't have the benefit of electronic gubbins that they could feed snippets of information into in such a way that it churned out what they wanted to hear. Poor benighted souls!
EM,
Indeed, but when I pointed out that one should be careful how one interpreted the data in this graph, all the responses suggested that was obvious and that I was being condescending (shock, horror). Strangely enough, though, even though it was claimed to be obvious, noone seemed to moderate their interpretation of this graph.
Hunter
In cause-and-effect order
Decreased sea ice extent
Warming of Greenland
Increased ice melt from Greenland
Decreased salinity in North Atlantic surface waters
Decreased sinking of water into thermohaline corculation.
Blocked Gulf Stream.
Increased storm formation in Both Atlantic.
Increased storm activity over UK.
Entropic man (Mar 30, 2016 at 1:12 PM), I note that Hunter asked "what has been the impact?" not what *may* be the impact... or maybe you can point me to the empirical evidence that the things you note have indeed happened?
By the way, I the "Blocked Gulf Stream" impact seems more like your wishful thinking and so only serves to undermine the credibility of your 'contributions'.
David Salt
This is the distribution of global temperatures for January 2016.
Note the blue pool of surface water "much cooler than average" between Greenland and the UK. Note the red
David Salt
This is the distribution of global temperatures for January 2016.
Note the blue pool of surface water "much cooler than average" between Greenland and the UK. This is the cold pool formed by Greenland meltwater.
Note the red "Record warmest" squares in the Atlantic East of the Caribbean and off the US East coast. This is warm Gulf stream water which been prevented from moving NW .
The interface between the warm and cold water is where the storms we experienced this Winter have been forming.
Sorry, EM, but my own reading of the graph that you linked to shows agreement with that which the Bishop has given us at the top of the page – there was a decline until about 2006/7, since when there has been very little change.
Now, I accept that this is only over a decade, which, in global terms, is less than the blink of an eye; however, the total time of the graphs is just 3.5 decades – again, barely worth even mentioning, in the time-scale of this planet, though is does originate at a time when we were being warned of the onset of another ice-age. Others on this thread have expanded the time-scale, referring to reports and records of times past, which indicate that ice levels have been as low or lower in recent history; naturally, of course, you will dismiss these, though, no doubt, you will happily accept the “reconstructed” changes (much of which appears to invalidate much of the records and reports that have been accepted until recently) ER has linked to in your desire to maintain your fears.
EM
I see you are still somehow unaware that Gulf-Stream shift notion was a myth. Refer to this page from Richard Seager.
http://www.ldeo.columbia.edu/res/div/ocp/gs/
And note that Seager is also a ridiculous alarmist on climate change but this stupidity was one step too far for him...clearly not for you though!
Or as Carl Wunsch more succinctly wrote to the Economist magazine; 'it couldn't happen unless the world stopped spinning'.
Entropic man (Mar 30, 2016 at 2:28 PM), in my opinion your 'empirical evidence' is far too ambiguous to support your cause-and-effect hypothesis, which sounds more like hand-waving. Sure, there may be some of these effects in play but I don't see any evidence for them being of any real significance.
Having said that, here's a recent paper...
http://www.sciencedirect.com/science/article/pii/S246801331500008X
...which concludes that "[c]laims of strengthening or reducing of the AMOC are therefore pure speculation". Also, I though the Gulf Stream was a wind-driven surface current and so fail to see how it can be "blocked" by the thermohaline circulations. However, I may have misunderstood this so please correct me if I'm wrong.
Also I thought it was well-known by now that the NAO and the Jetstream have the lions share of the blame for any increased storminess in the UK which has been tracked to a 60 year natural cycle. Researcher may freely speculate (with zero data or theory) whether it will get worse with so-called manmade warming but then it is equally valid to postulate the opposite and the paid alarmists certainly do so whenever a drought or a heatwave appears in England.
For background see...
https://www.ipcc.ch/publications_and_data/ar4/wg1/en/ch3s3-6-4.html
"The NAO exerts a dominant influence on winter surface temperatures across much of the NH, and on storminess and precipitation over Europe and North Africa. "
http://www.metoffice.gov.uk/media/pdf/n/i/Recent_Storms_Briefing_Final_07023.pdf
"As yet, there is no definitive answer on the possible contribution of climate change to the recent storminess, rainfall amounts and the consequent flooding. This is in part due to the highly variable nature of UK weather and climate."
"These extreme weather events on both sides of the Atlantic were linked to a persistent pattern of perturbations to the jet stream"
You really should educate yourself a bit more....!
RR,
Except this doesn't follow from the figure. The figure is showing absolute (not relative) anomalies, which are measured with respect to the 1979-2008 mean for each month (I think month, at least). Hence a large anomaly in a month in which the sea ice extent is expected to be high is less significant than a large anomaly in a month in which the sea ice extent is expected to be low. You really need to compare anomalies for the same month to determine if there is some kind of overall trend, or not.
It's similar to the error that some make when they claim that we've had the highest temperature on record because the anomaly in February is the largest ever. February, however, is typically globally colder than July, so even if the temperature anomaly in February is the largest anomaly on record, it doesn't mean that the temperature itself was the largest on record - you need to correct for the difference between a typical February temperature and a typical July temperature.
Radical Rodent
What a simplistic interpretation. Is a six year flatter spot between 2007 and 2013 all you can see?
This is not the clearest way to present the data, (which is why Andrew Montford chose it) but it can be informative.
Look a little closer.
There is a summer record minimum in 2007 and another in 2012.
There are new winter maximum minima in 2015 and 2016.
Between 2007 andb2013 the smooth cooling trend becomes much more variable. Did the trend really flatten or are you just seeing what you want to see among the noise.?
From 2013 the downward trend resumes.
Attp
Skeptics don't expect or look for a trend or pause or anything else. We are just reminding the casual reader that alarmists have been wrong in the past about the significance of these single datapoint drops or rises which were negated by subsequent recoveries. The Arctic is clearly not 'screaming' nor 'shifting into a new state'. It is fluctuating just as it did before 1979 as the earlier link to the IPCC document clearly shows. The temperature in the Arctic is still the same as it was in the 1930's and nothing alarming is happening yet! Whether you read anything else into this data is entirely dependent on whether you are pessimistic or objective. As I have demonstrated above, your colleague in pessimism, EM, seems to believe anything alarming even when the actual scientific consensus says it is rubbish. This attitude does not advance the science.
JamesG (Mar 30, 2016 at 4:06 PM), I agree completely when you say "Whether you read anything else into this data is entirely dependent on whether you are pessimistic or objective".
To me, these sort of plots are effectively Rorschach tests that tell us more about the psychology of the person interpreting them than the physics behind the phenomena they try to measure.
Interesting. I don't remember an "Assume you're a pessimist; interpret the following data" question in any physics exam I've ever seen.
...and Then There's Physics (Mar 30, 2016 at 5:22 PM) said "Interesting. I don't remember an "Assume you're a pessimist; interpret the following data" question in any physics exam I've ever seen."
I expect that's because physics is nowhere near as 'politicised' as climate science, which appears to be driven by the need to publish scare stories that support the CAGW ‘meme’ rather than an objective evaluation of the evidence.
This is why I told Ken months ago "and Then There's Everything Else".
One word, folks, 'volume'. That one doesn't require trust in moods, only in models.
==================================
Aha! Climate heathens hide and run when the real scientists show up to demonstrate beyond a shadow of a doubt that the ongoing, plain-to-see, runnaway climate disasters that we witness constantly are caused by human activity.
Your days are numbered, deniers.
Take 2 newspaper headlines :
1) There is an asteroid 2 billion light years away but it will most likely miss Earth
2) There is an asteroid 2 billion light years away and it is likely to collide with Earth
Which paper will sell the most copies ?
The answer is simple, Owen, the paper that blames humanity for it.
David Salt
I dont have time for a long post now, but I think you'll find that Parker and Offlier(2016) is the conservative minority position among those studying AMOC. Since the current behaviour of the system is unfamiliar, any hypotheses are work in process. It will be interesting to see what is published after this Winter has been studied in depth.
IIRC what drives the Gulf Stream is that water moving into the Greenland sea from the North Atlantic becomes saltier by evaporation. When it is dense enough it sinks off the Greenland coast and flows South along the deep sea bed. The Gulf Stream flows NE to replace this sinking water.
If the Gulf Stream were wind driven it should be speeding up as the temperature gradient increases windspeed, not dithering off the US Eastern seaboard increasing temperatures and local sea levels.
How long does the decline in sea ice have to have stopped before Climate Scientists have to start writing papers attempting to explain why it has stopped declining?
Is this a pause, or hiatus or something? Perhaps we could help by suggesting alternative descriptions
To keep it in familiar technology/jargon, is it about as level as an Ice Hockey Rink? (before smoothing obviously) Or the shaft of a Hockey Stick Graph? The skaters grooves visible are more prominent than Mann's computer adjusted LIA and MWP.
The long-term trend in Arctic SIE is -53,500 km2/yr.
Do you think the trend since last Tuesday is going to change that?
If so, why?
golf charlie wrote:
"How long does the decline in sea ice have to have stopped before Climate Scientists have to start writing papers attempting to explain why it has stopped declining?"
Um, more than a couple of years?
How long do you think Arctic SIE has been in decline, anyway?
Do you honestly not see how a reliance on very short-term trends by people like you just keeps undercutting your claims??
James G wrote:
"The Arctic is clearly not 'screaming' nor 'shifting into a new state'. It is fluctuating just as it did before 1979 as the earlier link to the IPCC document clearly shows."
The data show it is most certainly NOT fluctuating as before. In fact, some people think that Arctic SIE has already passed a tipping point -- that its SIE is nothing like what it was before the 1960s. Graph here:
http://www.arctic.noaa.gov/images/ice_extent.gif
The decline in Arctic sea extent has created a feedback/forcing of about 25% of CO2's -- see this analysis by Pistone et al:
K. Pistone, I. Eisenman, and V. Ramanathan (2014). Observational determination of albedo decrease caused by vanishing Arctic sea ice. Proc Natl Acad Sci USA 111, 3322-3326.
http://eisenman.ucsd.edu/papers/Pistone-Eisenman-Ramanathan-2014.pdf
An RF of 0.25 x CO2 is certainly NOT just a fluctuation....
Radical Rat wrote:
"I see an unremarkable variation in sea ice extent; I do not see the Arctic “screaming”."
Rat: Show me the variation -- up and down -- in these data:
http://www.arctic.noaa.gov/images/ice_extent.gif
which comes from Walsh and Chapman (2000):
http://www.arctic.noaa.gov/essay_untersteiner.html
More information here, courtesy of Gavin Schmidt.