A warm welcome to the climate blogosphere for Kate Marvel, a theoretical-turned-climate physicist at the Lawrence Livermore laboratory.
Dr Marvel's new blog can be seen here, and the first couple of posts make fascinating reading. Today's effort is right up my street, considering the empirical evidence for global warming.
[I]ncreased carbon dioxide warms the lower atmosphere (closer to Earth), but cools the upper atmosphere (closer to space). I will probably write more about this later but for right now you'll have to take my word for it (or go here).
Dr Marvel and I are probably on the same page. As a fully accredited lukewarmer, I'm expecting to see some gentle warming in future decades. I'm not really au fait with the theory behind a cooling upper atmosphere, so I'm happy to go along with the idea that we will expect cooling there.
So much for the theory. What is the story on the observations?
[I]s this happening in the observational data? Is the signature of what we're doing evident amidst all the other things the climate system gets up to? To go back to our example: multiple satellite missions have now established that the lower atmosphere is warming while the upper atmosphere is cooling. Not climate models, climate observations. We're pretty sure that this is happening.
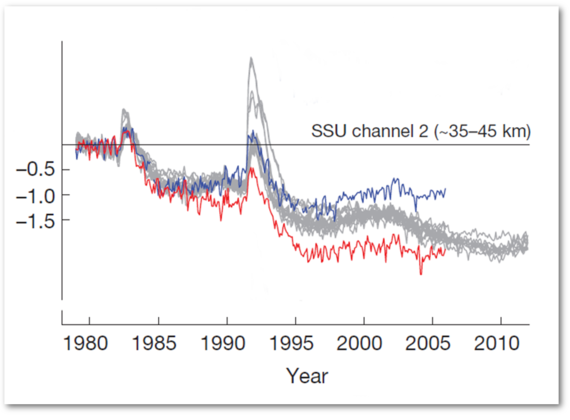
Now this is really interesting, because I was recently copied in on some correspondence regarding the empirical evidence for stratospheric cooling. This centred around a graph derived from a recent paper in Nature by David Thompson et al, entitled "The mystery of recent stratospheric temperature trends". The abstract reads as follows:
A new data set of middle- and upper-stratospheric temperatures based on reprocessing of satellite radiances provides a view of stratospheric climate change during the period 1979–2005 that is strikingly different from that provided by earlier data sets. The new data call into question our understanding of observed stratospheric temperature trends and our ability to test simulations of the stratospheric response to emissions of greenhouse gases and ozone-depleting substances. Here we highlight the important issues raised by the new data and suggest how the climate science community can resolve them.
The graph in question looks like this:
 The red and blue lines are different empirical estimates of the temperature, while the grey ones are computer model simulations. As you can see, there is a startling difference between the Met Office (in blue) and NOAA (in red). As the paper suggests this is a bit of a problem:
The differences between the NOAA and Met Office global-mean time series shown in Fig. 1 are so large they call into question our fundamental understanding of observed temperature trends in the middle and upper stratosphere.
Moreover, the cooling seems to be associated with the 1991 Pinatubo eruption and its aftermath with stratospheric temperatures if anything rising at other times. So while you could claim that the stratosphere has cooled, you can't claim that you have found any evidence for manmade global warming.
A mystery indeed.
 Bishop Hill