


Wednesday
Feb272013
by  Bishop Hill
Bishop Hill Still still
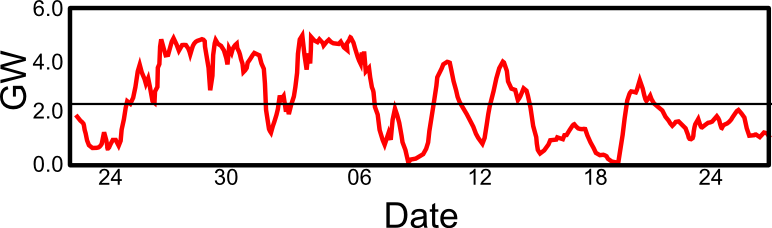
Energy: wind There has been precious little wind over the last month. The graph below, redrawn from here, shows that most of the time output has been less than 2GW, roughly 5% of average daily demand.
And as we learned yesterday, widescale deployment of wind farms will produce power plants that are even less efficient.
Reader Comments (16)
Even "The Bard" anticipated wind turbines.
Blow, blow, thou winter wind
Thou art not so unkind
As man's ingratitude;
Thy tooth is not so keen,
Because thou art not seen,
Although thy breath be rude.
Still Still, but then what may happen when it does blow:- (H/T GWPF)
"Windmills at sea can break like matches"
"Medium-sized waves can destroy wind turbines at sea, causing them to break like matches. Mathematicians are trying to explain why."
"Financial ruin"
"The ringing problem may increase significantly in the years ahead. There are plans to build tens of thousands of wind turbines at sea.
"If we do not take ringing into consideration, offshore wind turbine parks can lead to financial ruin," warns John Grue."
Full article;-
http://www.apollon.uio.no/english/articles/2013/windmills.html
Of course, just providing the output is of limited value. What we really need is the actual output, set against, ideally, the predicted design output. You could throw in the maximum theoretical possible output while you're at it...
Continuous as the stars that shine
and twinkle on the Milky Way,
They stretched in never-ending line
along the margin of a bay:
Ten thousand saw I at a glance,
tossing their heads in sprightly dance.
Perhaps the Bard wasn't thinking about daffodils?
What is more aarmiing than the average output is the varliability.
From >4 GW to <1 GW in the course of a day or two.
Just wait until we have thousands more of the useless objects and our use of electricity is forced to follow the variability of wind energy production.
Feb 27, 2013 at 3:06 PM | Green Sand
Do they 'bonk test' windmills?
Extract from a post on pprune.org:
At which point one should explain what a bonk test is. This is a method by which the resonant frequencies of discrete parts of an aeroplane can be determined. The part is fitted with a very lightweight high rate accelerometer feeding an equally high rate data-logger. You then hit the item with a calibrated soft faced hammer (actually it's usually a device firing a little rubber encapsulated bullet nowadays). So, when you hit the aircraft part, it resonates (one hopes briefly!), this is recorded by the data logger, and you can then run that data through an FFT analyser - this tells you what the resonant frequencies are of the part. You obviously don't want this to, say, co-incide with any of the normal cruising RPM values of the engine.
Billy Liar @ Feb 27, 2013 at 3:35 PM
They might not "Bonk Test" windmills, but we all know who gets screwed.
The graphs not only show how useless wind is to meeting our power needs, but how key gas is to meeting those needs. If you look at the "Weekly Nuclear/Coal/CCGT (GW)" graph, the vast majority of daily fluctuations in demand are met by adjusting the output of the gas-fired power stations. Compare this with "Weekly Hydro/Pumped/Wind/Bio. (GW)" graph, with wind power being totally unrelated to demand. Also note the different scale as well.
Conclusion that I draw is that we should focus new supplies of gas, not more of the wind turbines.
But hang on. Louise Gray of the ToryGraph says:
“Already there are 4,366 turbines in operation in the UK providing 8.2GW of power, enough to power 4.5 million homes for a year”
That must be right, surely? More
When there's more power than the system can handle, the IESO sells it to neighbouring provinces and states -- sometimes at a loss, and sometimes actually paying them to take it.
http://www.smalldeadanimals.com/archives/we-dont-need-no-256.html
However in the fantasy land of renewable this is not a problem for by 'magic' the lack of wind it not going to effect how useful wind power is going to be.
There's lots of great stuff on that Gridwatch page that I hadn't seen before. The energy output can be downloaded as a csv which has several months of data sampled every 5 mins. The raw data can also be queried via the bmreports webservice.
So there's lots of potential to do some automated stats and reporting above and beyond what is shown on Gridwatch and bmreports.
But hang on. Louise Gray of the ToryGraph says:
“Already there are 4,366 turbines in operation in the UK providing 8.2GW of power, enough to power 4.5 million homes for a year”
That must be right, surely? More
Feb 27, 2013 at 6:52 PM | RichardM
//////////////////////////////////////////////////////////////
The research suggest that windfarms produce only approximately 25% of their installed capacity. Accordingly if the UK requires about 50GW of power, and if the aim is that renewables, substantially wind, should produce 30% of the UK energy requirements (say about 16GW) then we need installed capacity of about 64GW of wind turbines. Once we have 64GW of windfarm installed capacity, that capacity will on average produce about 16GW (ie., the typical 25% figure) and this will then fulfill the long term goal by contributing (on average) about a third of the UK energy requirement.
Of course, the real problem goes beyond the above inefficiency. The real problem is that when peak energy demand occurs, ie., cold winters with a blocking high over the UK, then real output falls to about 1 to 5% of installed capacity. Thus to meet a third of UK energy requirements in harsh winter conditions we need approximately 350GW of installed windfarm capacity.
This is the economical fiasco of wind. The fact that it achieves no saving in CO2 emissions because of the need to have coal or gas conventional generators as backup is the icing on the cake.
Whoever would have thought that there was a case for wind, and that wind should be pushed over other more conventional forms of power generation must surely be mad, or just plain dumb. They certainly have not learnt from the experience of the winter of 2010.
Just adding to all of the above - at one point last week, the contribution from wind fell to below 0.1% of electricity demand..
Also - I'm slightly confused as to the installed capacity re wind farms - NETA seemed to indicate that there was some 4.5GW available (of which the 0.1% figure equated to actual output of as low as 28MW) whereas the figure which Louise Gray states is 8.2GW. Maybe someone can enlighten me regarding this apparent discrepancy.
If, in fact, the installed capacity IS 8.2GW, then 28MW is next to laughable..!
I tried to look at NETA (www.bmreports.com), but the web site was having problems.
I think the source for Louise Gray's figure of 8.2GW installed capacity is probably the same as Wikipedia's: The European Wind Energy Association.
http://www.ewea.org/fileadmin/files/library/publications/statistics/Wind_in_power_annual_statistics_2012.pdf
BTW, right now at http://www.gridwatch.templar.co.uk/ the wind contribution to 46GW demand is 0.76GW (1.6%)