This is a guest post by Shub Niggurath.
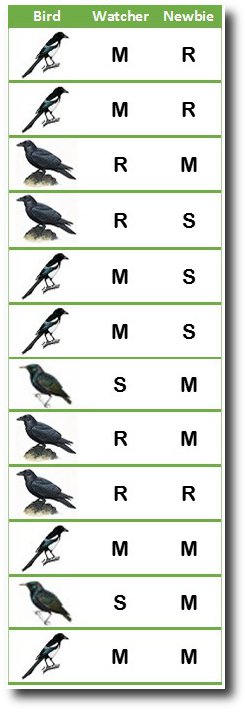 A bird reserve hires a fresh enthusiast and puts him to do a census. The amateur knows there are 3 kinds of birds in the park. He accompanies an experienced watcher. The watcher counts 6 magpies, 4 ravens and 2 starlings. The new hire gets 6 magpies, 3 ravens and 3 starlings. Great job, right?
No, and here’s how. The new person was not good at identification. He mistook every bird for everything else. He got his total the same as the expert but by chance.
If one looks just at aggregates, one can be fooled into thinking the agreement between birders to be an impressive 92%. In truth, the match is abysmal: 25%. Interestingly this won’t come out unless the raw data is examined.
Suppose, that instead of three kinds of birds there were seven, and that there are a thousand of them instead of twelve. This is the exact situation with the Cook consensus paper.
The Cook paper attempts validation by comparing own ratings with ratings from papers’ authors (see table 4 in paper). In characteristic fashion Cook’s group report only that authors found the same 97% as they did. Except this agreement is solely of the totals – an entirely meaningless figure
Turn back to the bird example. The new person is sufficiently wrong (in 9 of 12 instances) that one cannot be sure even the matches with the expert (3 of 12) aren’t by chance. You can get all birds wrong and yet match 100% with the expert. The per-observation concordance rate is what determines validity.
The implication of such error, i.e. of inter-observer agreement and reliability, can be calculated. In the Cook group data, kappa is 0.08 (p <<< 0.05). The Cook rating method is essentially completely unreliable. The paper authors’ ratings matched Cook’s for only 38% of abstracts. A kappa score of 0.8 is considered ‘excellent’; score less than 0.2 indicates worthless output.
With sustained questions about his paper, Cook has increasingly fallen back on their findings being validated by author ratings (see here, for example). Richard Tol’s second submission to Environmental Research Letters has reviewers adopt the same line:
This paper does not mention or discuss the author self-ratings presented in the Cook et al paper whatsoever. These self-ratings, in fact, are among the strongest set of data presented in the paper and almost exactly mirror the reported ratings from the Cook author team.
The Cook authors in fact present self-rating by paper authors and arrive at 97.2% consensus by author self-ratings.
In reality, the author ratings are the weakest link: they invalidate the conclusions of the paper. It is evident the reviewers have not looked at the data themselves: they would have seen through the trickery employed.
[1] Sim J, Wright C. The Kappa Statistic in Reliability Studies: Use, Interpretation, and Sample Size Requirements. Physical Therapy March 2005; 85(3): 257-268. •• A well-cited review that provides good general description.