One of the questions I would have liked to ask at the Cambridge conference the other week related to a graph shown by John Mitchell, the former chief scientist at the Met Office. Although Mitchell did not make a great deal of it, I thought it was interesting and perhaps significant.
Mitchell was discussing model verification and showed his graph as evidence that they were performing well. This is it:
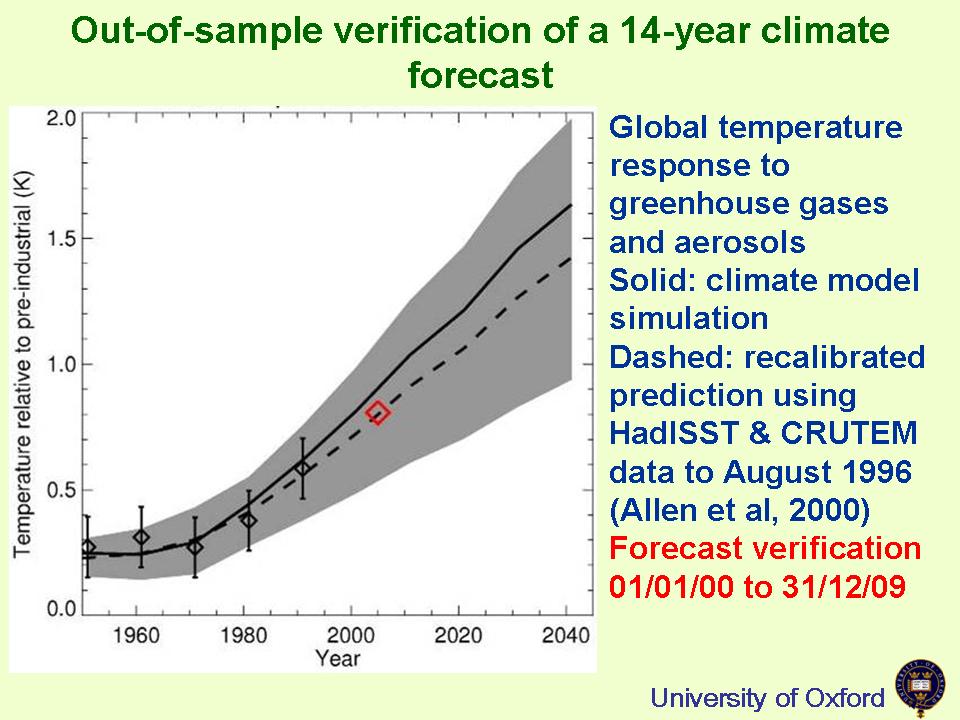
As you see, the data is actually derived from the work of Myles Allen at Oxford and examines how predictions he made in 2000 compare to outturn.
The match between prediction and outturn is striking, and indeed Mitchell was rather apologetic about just how good it is, but this is not what bothered me. What I found strange was that the prediction (recalibrated - but that's not the issue either) was compared to decadal averages in order to assess the models. As someone who is used to Lucia Liljegren's approach to model verification, I found the Allen et al method rather surprising.
The difference in assessment is obviously very different - Lucia is saying that the models are doing rather badly while Allen (Mitchell) et al are saying that they are doing fine. It seems to me that they cannot both be correct, but as a non-statistician I am not really in a position to say much about who is right. I have had some email correspondence with Myles Allen, who is quite certain that looking at sub-decadal intervals is meaningless. However, I have also read Matt Briggs' imprecations against smoothing time series, and his fulminations again smoothing them before calculating forecast skill.
We really ought to be able to agree on issues like this. So who is right?