


 Bishop Hill
 Steig's method massacred
Climate: Surface Ryan O'Donnell has posted a splendid pictorial guide to the oddities of Eric Steig's method for creating trends in the Antarctic. If you have been one of the people not following the story too well so far, here's a little layman's version of the posting, which assumes no prior knowledge. I hope this helps.
There's a lot of talk of the Antarctic peninsula. This is fairly obvious at the left hand side of each map below. The name refers only to the narrow bit of land though. The slightly fatter bit that joins the Peninsula to the main part of the Antarctic continent is West Antarctica.
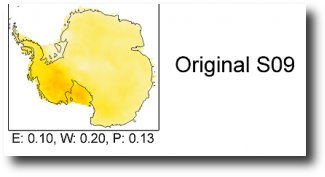
Now Steig's method purported to show that he whole continent was warming, and particularly West Antarctica. Previously it had been thought that only the peninsula was warming.
Here's Steig's original result with the warming showing up as the dark colour in West Antarctica.
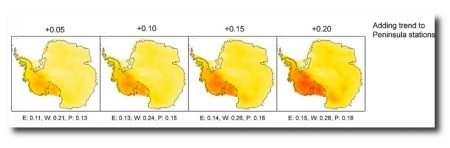
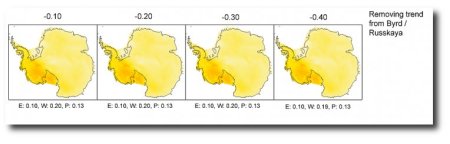
 O'Donnell has now shown what happens when you artificially add warming or cooling trends to some of the weather stations included in the dataset. Firstly see what happens when you add some warming to stations in the Peninsula. As you go from left to right in the map below, more and more warming is being added, but only to the peninsula stations. However, mangled by Steig's algorithm, this extra warmth turns up as warming, not in the Peninsula, but in West Antarctica.
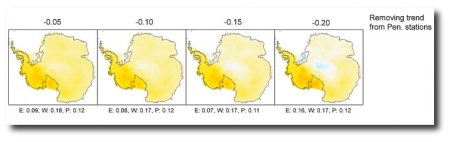
Now what happens when you cool those same Peninsula stations down? As you can see, the effect is to cool down the south Pole and, erm, to make West Antarctica warmer...
Now see what happens when you add warmth to stations that are actually in West Antarctica. Not much actually...
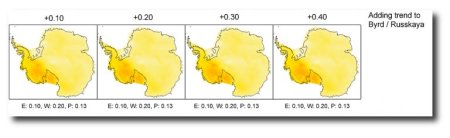
And what about cooling them down? No, that has no effect either.
 So what the Steig method does is to take any warmth in the Peninsula and spread it out over West Antarctica. In other words, Steig's result is an artefact of his methodology and not something that is inherent in his data.
Game, set and match.
Reader Comments (81)
Your Grace
A perfect explication.
This is the clearest explanation I've ever seen about this topic. This is a smackdown of epic proportions.
A very revealing illustration of the climatic history of Antarctica is shown in the following diagram of the Dome C ice core. Just double click the chart to get a good view.
http://www.c3headlines.com/2010/06/2010-antarctica-peerreviewed-research-ice-core-data-confirms-medieval-period-warmer-than-present.html
It shows our present position nearing the end of the current (Holocene) interglacial on the left, with all the minor warmings and coolings of human history in the little wiggles at its crest ( including the MWP), then the huge time frame of the last main glacial, with its oscillations, and preceeded by the previous, relatively short interglacial(warmer than present). As can be seen, we are fortunate indeed to find ourselves within an interglacial and able to colonise and cultivate high latitudes, but we have incredible arrogance and ignorance to not only fear, rather than celebrate warming, but to believe we trump the forces of nature. And all the while the clock is ticking to the descent into the next glacial.
The full paper with the original of that chart is fig 6a here
http://epic.awi.de/Publications/Ste2009a.pdf
"The strange thing about the whole episode is that the warming claimed by Steig was in reality trivial...." --Paul Maynard
Tangled web weaving often starts with a desperate little fib and escalates to huge public exposure. Actually, when his paper was questioned initially, Steig said much the same thing, that the SH icecap wasn't going to disappear any time soon.
Very lucid explanation
thanks
It makes the more scientific postings from RO accessible now..
The reddening (warming) of West Antarctica reminds me somewhat of the reddening of Steig's face in Josh's cartoon.
Vigilantfish:
Alas the coffin is strictly the statistical one used by Steig to identify supposed temperature signals.
A very clear explanation, Your Grace.
What Ryan did here was what any good scientist would do when faced with a result which appeared a little at odds with reality - namely a warming West Antarctic. He would do some sensitivity studies to see if the results were sensitive to any of the input parameters. Lo and behold, Steig at al did not do what any good scintists would do. This obviously says something about whether Steig et al are good scientists (or dishonest scientists). They are either one or the other.
Thanks for your eloquent summary of the artefact issue which is without any doubt Steig's achilles' heel. If Nature does not retract his 2009 paper then the only logical conclusion is that they have no desire to restore their tattered reputation.
For those who prefer real data as opposed to statistical manipulations and interpolations, the two pages for Dome A AWS have been moved recently due to a AAD website revamp - they are now:
Colder than cold: http://www.antarctica.gov.au/dome-a (but the live data feed seems to be down at the moment)
The temperature, wind speed/firection and relative humidity data is now at:
http://www.antarctica.gov.au/science/ice-ocean-atmosphere-and-climate/glaciology-research/antarctic-weather/research-in-focus/live-weather-from-dome-a
The temperature data only goes back to May 2004, but having zoomed in on the graph in an image editor, the 10m sub-surface sensor (which effectively damps the seasonal variations to the surface annual average) shows no apparent warming in the last 7 years. It varies between -57C and -58C depending on the time of year. Obviously this is only accurate to 1C, but it does at least confirm there ha been no runaway warming in the last 7 years. I am happy to accept that there has been some slight warmimg on the peninsula but that is evidently due to slightly warmer ocean currents - but I would be very surprised if there was any warming in the interior which is far removed from such an influence. And just as the Arctic had mild spells in the early 1800s and the 1920s, I see nothing to link late 20th century warming with CO2; long term oceanic cycles are much more likely the key factor.
Speaking of which, due to all the coverage of Steig's shenanigans, some may have missed the following which as far as I know only Jo covered front page -
The oceans, clouds and cosmic rays drive the climate, not CO2.
Dr Noor van Andel presentation at the Dutch Meteorological Institute (KNMI), Feb 2011
http://joannenova.com.au/2011/02/the-oceans-clouds-and-cosmic-rays-drive-the-climate-not-co2/
The latest paper “CO2 and Climate”: http://climategate.nl/wp-content/uploads/2011/01/CO2_and_climate_v3.pdf
and full slide set pdf: http://climategate.nl/wp-content/uploads/2010/09/KNMI_voordracht_VanAndel.pdf
And Pierre Gosslin posted Matti Vooro's latest essay 'Are European Winters Going To Stay Warm?' over at the No Tricks Zone:
http://notrickszone.com/2011/02/07/are-european-winters-going-to-remain-warm/
What strikes me is the contempt.
I will forgive people showing contempt if for example they are "afflicted" with being a genius. For example a musical genius.
But this lot? Little league when thinking they are big league.
Showing contempt to those who can makes fools of you is a foolish course...
Vigilantfish @ Feb 8, 2011 at 10:08 PM brings to mind an important fact. This work does little to dis-prove the theories, and I think some people here need to take a while to understand that. All this episode shows us is how keen the scientists are to promote their own abilities to come up with data that supports their hypothesis. In itself, this data point is trivial - the trend is near enough zero.
The basic theory that CO2 and feedback is the only explanation of the the observed global trends and that CO2 'must' have an impact even if we can't measure it is not addressed by this non-data-point. Even if the scientists are not credible, they might still be right by chance. There is still more work to do if we need to prove their result wrong as well as their method.
Eric Steig has now said: O'Donnell's "allegations have no basis in fact".
Which allegations?
"Which allegations?"
That Steig baited him into using a statistical method (using his power as a reviewer) that Steig could then criticize after publication to discredit the paper.
In the comments at ClimateAudit:
" Ryan O'Donnell
Posted Feb 8, 2011 at 3:43 PM | Permalink | ReplyYes . . . Bish’s explanation is much better than the above."
My feeling too. Congrats and I look forward to your next book!
Well I hope for all our good that Ryans allegations are water tight!
What concerns me the most though is how Ryan knows that steig was reviewer a??
Regards
Mailman
At RealClimate, Eric Steig has promised to post a response later today to the points raised by Ryan. IMO, he seems somewhat surprised and taken aback by these images. Perhaps, I hope, some type of rapprochement is in the offing.
Mailman:
Yesterday, Ryan posted a snippet of an email from Eric wherein Eric acknowledged that he had submitted three reviews. Only Reviewer A, according to the copies of the reviews and other information Ryan posted at ClimateAudit, submitted three reviews. (see http://climateaudit.org/2011/02/07/eric-steigs-duplicity/#comment-254131)
Well, Your Grace, I echo everyone else's praise here of your explanation. I AM a scientist (though not a climate scientist), and I learned much more, and more easily, reading here than at CA from Ryan O. Feynman once said that unless you can explain your work clearly to a first grader you do not really understand it yourself. I do think that Ryan O. understands fully his own work, but the communication of it is extremely important. One of the things that made Feynman great was his communicational ability. IMO, you, Your Grace, are in that company.
Thanks for that explanation. It didn't fully click for me what the series of maps represented until I read this post. The only thing I would add is a couple of black dots indicating the stations. Amazing that they could affect the temps so far away...!
@Mailman
further to the above from 'bernie'...
On Lucia's "In Moderation at RC: Yes? No? Whatever?" post
=============================================
Steve McIntyre (Comment#68626)
February 9th, 2011 at 9:10 am
In an email yesterday to Ryan and Jeff Id, Steig stated:
I mentioned the problems with k_gnd in my first, second, and 3rd reviews. You never addressed these in a satisfactory manner (at least, not convincing to me).
In his RC comment, Steig stated:
Now you have my word against his [Ryan's]. Now try thinking,-eric]
Yup.
=============================================
Also, Lucia seems to have seen something in private:
"Shub– Not giving context. I will only say that I now know Steig is a weasel."
Does it appear that CAGW scientist are always trying to find ways to spread the warmth. In Antarctica, in teleconnected trees (Finnish trees do not respond to Finnish temperature if they happen to correlate with Swedish temperature) in “one tree to rule them all”, in GISS 1200 k anomaly spreading. What have I missed?
I can almost hear them speaking of the missing heat saying, “don’t hide it, divide it” Oh wait, no, that was a conversation from the 60s.
Ryan O'Donnell reproduced the email exchange with Steig in the comments here:
http://rankexploits.com/musings/2011/steig-the-shameless/
Strange that Steig appears to be denying that he was Reviewer A, when the email purports to have him writing this:
Monday, December 6, 2010 11:54 AM
Ryan,
You are correct that I was a reviewer, but I think it would be quite inappropriate to publish these reviews, nor to mention that you know whom the reviewer was.
…
Best wishes,
Eric Steig
I suppose it is possible that O'Donnell has made this up, but I wouldn't bet on it.
On another pole, "Arctic Death Spiral" is also massacred, but comes back from the dead.
http://wattsupwiththat.com/2011/02/09/arctic-death-spiral-actually-more-like-zombie-ice/
Thanks for the confirmation guys.
Regards
Mailman
An hour or two looking at a map of the weather stations in Antarctica and at the corresponding temperature data reveals the absurdity of this controversy. Almost all the stations with reliable long term data are on the shore line all around the continent. Only one or two are actually in the interior. I don't think it is any coincidence that the station which shows no warming at all is at the South Pole, right bang in the middle.
I have great sympathy with the bloggers here who are confused by the statistical methods being employed in this debate on either side. It is important to keep a sense of proportion and to think through logically the topography before going needlessly for statistical methods of any sophistication.
Surely it stands to reason that if you take the temperature records from a couple of dozen stations all round the coastline plus just the two available from the interior (South Pole and Vostok) then the average (however sophisticated the computation) will be closer to the average around the coastline! Now it happens that almost all these coastline stations are MUCH WARMER THAN THE INTERIOR.. This is easily explained by the fact that they are measuring the air temperature adjacent to the ocean (typical averages are in the range minus 5 to minus 12degC) which is much, much warmer than in the vast interior of the continent. Also sea temperatures have been warming very slightly in the last 30 years or so in line with temperatures all over the world.
In contrast the average temperature at the South Pole is around minus 49.5degC and at Vostok it is around minus 55.5degC. Neither has increased significantly in the last 50 years. Therein lies the absurdity of trying to do ANY kind of gridded averaging between the coast and the interior. Imagine that instead of just 2 stations in the interior you had several hundred. They would of course mostly reveal temperatures similar to Amundsen-Scott (South Pole) and Vostok, thus exhibiting that the WHOLE OF THE VAST INTERIOR AWAY FROM THE COASTLINE IS VERY, VERY, VERY COLD and, being well away from the warming ocean, is not increasing in temperature significantly.
You don't need a degree in statistics to reason all that out. Just common sense - sorely lacking it would seem in the academic world of climate science.
Bishop, you refer to the Arctic initially in this post when I think you mean Antarctic. Maybe I'm wrong...
Given that the peer review process seems to be broken, why not make some changes to fix it? Wouldn't it be better to identify the reviewers and to make the actual reviews part of the archives for that paper (including the input data, the output results, intermediate results, and the computer source code and test plan)? Radically increasing transparency in climate science would restore some credibility to the science.
The whole approach to scientific papers seems a bit absurd because it radically increases the cost, decreases the transparency, facilitates gate keeping corruption by editors, political back stabbing by reviewers, slows down the process in unproductive ways, and locks results that are paid for by the public behind a pay wall. Because of the per page cost, it also discourages thorough archiving of everything associated with the project. The corruption and politicization of climate science has been facilitated by the current scientific publishing system. The new science journals that are non paper based should be encouraged. These new internet based scientific journals should emphasize complete transparency. One result of reforming the scientific publishing system will be for non establishment perspectives to be more visible.
Nothing beats a really nice visual. Thanks Bishop. It becomes patently clear that 'magic code' inserted into the algorithm gets you a winning lottery ticket every time apparently. I am so worn out with these asshats and their trick code and badly bent "data sets".
Could you imagine trying to defeat this scam without the internet...? Too bad Eric the Red can't be put in stocks and let the public throw veggies and stuff. At least we can do it metaphorically.
Has anyone attempted run Stiegs analysis without making any temperature adjusts at all?
I suspect we'll discover some warming, somewhere, based on steady-state temperatures in the Peninsula.
Excellent, thanks BH.