


Saturday
Nov272010
by  Bishop Hill
Bishop Hill The Arctic gap
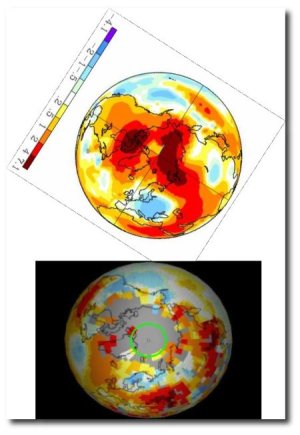
Climate: Surface Andy Russell has posted an interesting graph in an attempt to provide support for the notion that things are still warming up, despite the cold we are experiencing in the UK at the moment.
The GISS derived figure shows a view of Arctic temperature anomalies, with the pole apparently experiencing temperatures 4-7° (not sure if this is F or C) above normal.
The problem with this is that there is almost no data to support this, as Stephen Goddard has previously shown. (GISS fill in with model-derived numbers, upon which nobody should surely place any reliance.) I've constructed a composite of Andy's GISS chart and Goddard's figure showing which gridcells have real data to support them.
Reader Comments (74)
Question, Why does GISS use 1951 to 1980 as their baseline? would it not be more sensible to use 66-95, half a cool period and half a warm period? If 66-95 was used, how much lower/higher would these anomolies be?
Pielke, Sr. has written on the interdependance of the data used by the three land temperature sets, such as here:
http://pielkeclimatesci.wordpress.com/2009/11/25/an-erroneous-statement-made-by-phil-jones-to-the-media-on-the-independence-of-the-global-surface-temperature-trend-analyses-of-cru-giss-and-ncdc/
I suppose GISS is the most creative. :)
Sorry I am late here. I've put up two UAH TLT temperature plots for you. Rotation is about the same as the ones shown in the good Bishops article.
http://daedalearth.wordpress.com/2010/11/28/arctic-uah-tlt-polar-temperature-plots/
Click on the images for full size.
(on Wordpress servers and so bandwidth is not mine)
(is not a fish for traffic, is just information to the wind)
I'm confused. Again! Why are many here, so dismissive of GuessTemp when it clearly does what it says it says on the tin?
Is it any worse than other marketing strategy, eg "9 out of 10 cats prefer ..."?
Whatever ones interpretation of interpolation is, or expectation of extrapolation for that matter; does it make any difference to the real world.
It's not as if ones choice of cat-food would change the world order.
So why should it matter if a few academic, eggheads push for the promotion of their guesses over others?
It's not as if anyone, important, will take any notice of their illogical rantings.
Zed and Fred and Stevie 2, understand this. High 5 boys!
I'm saddened that others, on this blog, don't follow their noble and pragmatic examples.
:(
Love your sense of humour Roy :
Mailman
LOL Roy :)
Whether GISS polar coverage is a result of interpolation or extrapolation, or some inventive combination of the two, in the real world nobody thinks that a comb-over is a good thing!
RoyFOMR
Hansen is putting the Guess Temp records together for the next 10 years. They match his predictions, apparently.
All this reminds me of one of my many careers, that of high tech company marketing manager in Silly Con Valley. We used to use a model to predict customer reactions to our latest and greatest technological break throughs which was used very successfully during the late 1990 when we went through the Dot Com bubble. It was called the SWAG. It stood for Super Wild Ass Guess. Sounds like that is what Hansen is using.
The great thing about the SWAG model is you don't really need data, you just make it all up on a spread sheet after having a couple glasses of wine.
Of course, reality busted in and we had to sober up, but it was fun while it latest.
Dear Santa
What I would like for Christmas is some REAL polar temperature measurements. We are very poor, so I have to make do with homemade ones and all the other kids laugh at me. I know you are very busy at this time of year but you do live at the North Pole, so please could you pop outside and read your thermometer?
Love
Jimmy Hansen (aged 69 3/4)
PS I have been good (well, apart from getting arrested a couple of times).
Just notice that the Cancun "UN global warming conference" is about to start -- how did I miss that? Something like 20 "heads of state" from such notable countries as "Brazil, Bolivia, Guatemala, Costa Rica, Ecuador, Colombia, Peru and Chile, Norway, Kenya, Ethiopia, Antigua and Barbados and Grenada."
I guess the leaders from Europe can't get into the air from their snow bound airports.
Interesting. And given the temperature in Cancun is 80F, one would expect them all to get there for some fun in the sun. I know I would, if I could. But I have to shovel the snow in my drive way again, and it is still November. Jezzzus!
Ha!
Thanks Dreadnought - first laugh of the day.
It's... it's a travesty, Don Pablo.
BBD,
My question is not related to whether the UK uses GISS or not. As a resident of the USA, that's clearly not my concern. My question is about how much serious examination GISS and its adjustment/extrapolation/wild-ass guesstimating/etc procedures have received. If I asked this question about Mann's Hockey Stick, I know the bishop could give me a pretty good summary. If I asked it about Rahmstorf's "worse than we thought" study and its statistical methods, I know I could get one from Lucia, Jeff Id, Steve and others.
Has GISS been turned inside out pursuant to a serious critique? If so, by whom and what was the result? If so, what was the response thereto?
It is my impression that much of what the climate science community accepts as perceived wisdom has never been looked at closely, if at all (see e.g. Mann, Jones, Rahmstorf et al). Someone purports to do a study, build a database, or whatever. They announce their findings and everyone accepts whatever they say as truth. No audit, no replication, nothing. Obviously, that was the case with CRU as we saw with the Harry-read-me file
Has anyone given a real hard look at GISS? (Even someone outside of the UK).
Stan
I was suggesting that the reason the UK sticks with CRUTEM is because it doesn't rate GISTEMP.
If you are a regular at Lucia's then I'm amazed that you ask 'how much serious examination GISS and its adjustment/extrapolation/wild-ass guesstimating/etc procedures have received'. Really astonished.
Look back in her archives - also look at Ron Broberg's blog. Search for Zeke Hausfather and Steven Mosher.
I don't mean to be rude, but I've done my best to help, and it's time for you to crack on and Google.
Have fun!
Ah, no Fred, wrong again. Just that with the anomolies used, and not referenced to the true temps, and then having a picture that is full of reds and burnt ochre, it kinda makes one think that the temps are way above freezing, yet, they are actually still VERY COLD.
Abit of truth in this discussion would be a start to getting it back on track.
RSS has a polar gap, UAH does not. Does anyone know a good article about how UAH plug it?
The whole business of temperatures is becoming meaningless unless it is clear what the methodology is. As an aside isn't it time the Americans joined the rest of the world and started using centigrade. However, the DMI is an excellent and trustworthy resource and shows the trending of temperature in the Arctic very clearly. There is in short no huge increase in temps although they have been slightly above the average in recent years but in 2010 they are very close to the average. Follow the DMI and forget GISS as they are worse than useless.
Dr John Christy of UAH:
[Emphasis mine]Stan,
This might answer your question re CRU and GISS: [1254850534.txt]
"RSS has a polar gap, UAH does not. Does anyone know a good article about how UAH plug it?
Nov 28, 2010 at 8:03 PM | Alexej Buergin"
Don't know an article.
RSS and UAH datasets are very similar.
RSS contain more high frequency data but there is visual evidence this goes beyond Nyquist, not serious. RSS also omits both poles; for low troposphere the high Andies, Himalaya, to a degree Antarctica. Arctic is sea level.
My guess is that RSS is slightly more cautious and taken with trying to provide fine detail, decide to omit some regions. Might also be worth looking at the ground path of the satellites to see why, don't go over the poles.
A subtle reason and I worry a little about going too far into strange stuff. The data is published on an unequal area grid. The polar regions are small. It all becomes a bit iffy, noise and errors will tend to dominate.
I've not noticed a significant problem with UAH polar coverage. What would it look like?
Two datasets of mostly the same thing, use both. Could be seen as they compete a little.
A major difference is RSS do 1987 onwards top stratosphere dataset.
Stan
There is a bulk read on getting GISSTEMP running and its workings at http://chiefio.wordpress.com/gistemp/
BBD: Interpolation is the filling in of data between two known data points on a graph or table. Extrapolation involves the "extension" of data past the end point of a graph or table by use of a calculated trend. So if you have a set of temperature readings on the west side of the Atlantic at a constant spacing (for the sake of the argument) and another set of temperature readings on the east side of the Atlantic also at a constant equivalent spacing. Then if you wanted an estimate of the temperature at ANY point between those two points you could interpolate what it was. If however you had a temperature graph, and your data extended only so far and you wanted to know the value of point beyond the end point of your graph you would "extrapolate" what that value was based on the trend of the known data.
Gilbert
Yes obviously. My point was (and is): how do you realistically decide that you are in effect extrapolating rather than interpolating?
It is a semantic and a technical question.
A data void the size of an ocean basin is a barrier to meaningful interpolation. From a practical perspective, attempting to calculate mid-basin SSTs from some coastal data is extrapolation.
I say this with specific relevance to the GISS approach to calculating temperatures across the polar Arctic.
Both interpolations and extrapolations have to be based on an assumption of the shape of the curve between the two points, or beyond the end of the data. For interpolations where the underlying physical phenomena are KNOWN to be linear, a linear interpolation can be used. If it is complex, the interpolation process becomes complex. You can also use linear extrapolation when you KNOW that the phenomenon changes linearly beyond the end of the data. Unfortunately, much interpolation and extrapolation is done because the data is hard to gather, or expensive, and the phenomena are not well understood. Which makes interpolation chancy, and extrapolation unacceptable. You need to look at the graph to see what is being inter/extrapolated to tell. I would not consider an average temperature between points on opposite sides of a major sea basin an interpolation. I would call it junk. I used to oversee/regulate this sort of stuff for nuclear powerplant data and models, and I once laughed out loud when one major corporation tried to do this to us using a computer code to "generate data".